Trend Continuation Chart Patterns
The S&P 500 is rising on the back of better than expected earnings and positive economic sentiments. The traders are upbeat; they expect more gains. But then—pause. Prices consolidate, they don’t move in any particular direction. Some panic, they think the trend is over. But experienced traders? They know that this is what it is – a classic continuation pattern that means the market is about to go even further.
There are no horizontal lines in markets. Such patterns are called trend continuation patterns, and they occur during short-term consolidations and function as platforms for the next movement of the trend. This is important because they enable traders to determine when to enter the market with better accuracy and with less risk.
For instance, a bullish flag is a steep rise in prices followed by a relatively small decline. Or the ascending triangle, where prices are constantly being pushed higher by buyers until the resistance is finally overcome, and the price breaks out. These are not just theory patterns; these have been seen in real-life situations, including Bitcoin’s price increase, and Apple’s stock performance.
However, there is a drawback: Not all patterns result in a profitable trade. Missing a signal, not paying attention to volume, or being fooled by a false breakout is costly.
Trend Continuation Patterns: why they matter
If you’ve spent any time analyzing price charts, you know the market moves in waves. Trends develop, stall, and—if momentum holds—resume their trajectory. But how do you know whether a pause is just a temporary breather or the start of a full-blown reversal? That’s where trend continuation patterns come in.
At their core, continuation patterns are structured pauses in a prevailing trend. Think of them as the market recharging before its next move. Picture a long-distance runner: they don’t sprint from start to finish without slowing down. Instead, they find a rhythm, conserve energy, and push forward when ready. The market behaves similarly. A strong trend won’t just vanish overnight—it often gathers strength in consolidation phases before breaking out again.
Why does this matter? Because if you can recognize these patterns early, you can position yourself for the breakout—before the majority catches on. Institutions and seasoned traders monitor these setups like hawks, waiting for confirmation before committing large capital. Retail traders who understand them gain an edge, too entering with precision instead of chasing moves after they’ve already taken off.
These patterns appear across all markets—stocks, forex, commodities, crypto. Apple’s stock formed an ascending triangle before a major rally. Gold often consolidates in a bullish flag before resuming its uptrend. Even Bitcoin has displayed classic pennants before explosive breakouts.
Common types of Trend Continuation Patterns
Trend continuation patterns signal that an existing trend is likely to persist after a brief consolidation phase. These formations are seen in various assets including stocks, forex, commodities and cryptocurrencies. It is important to identify them at an early stage so that one can enter the market at the right time and with minimum risk.
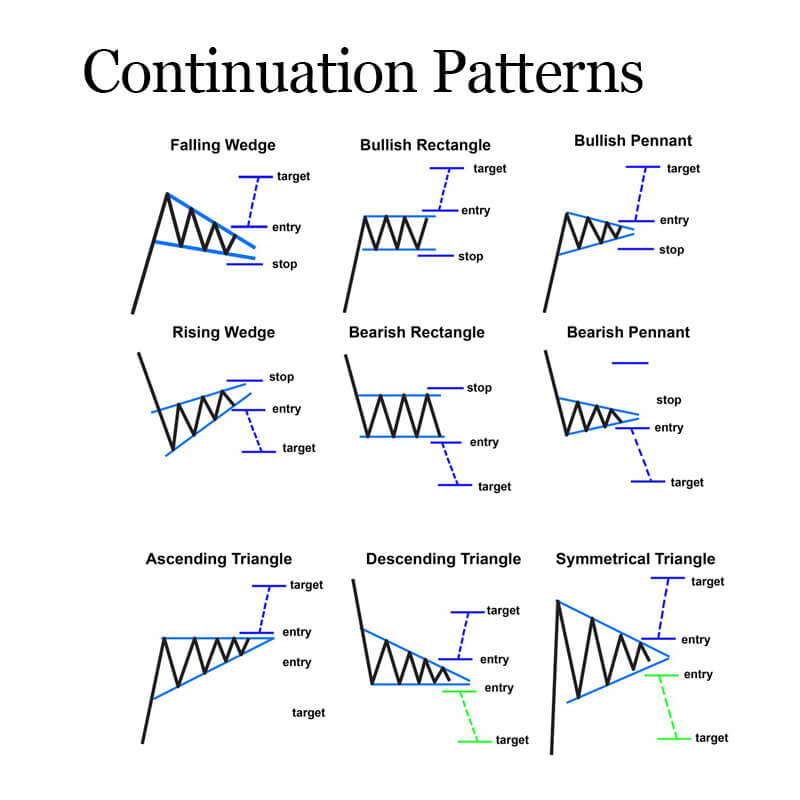
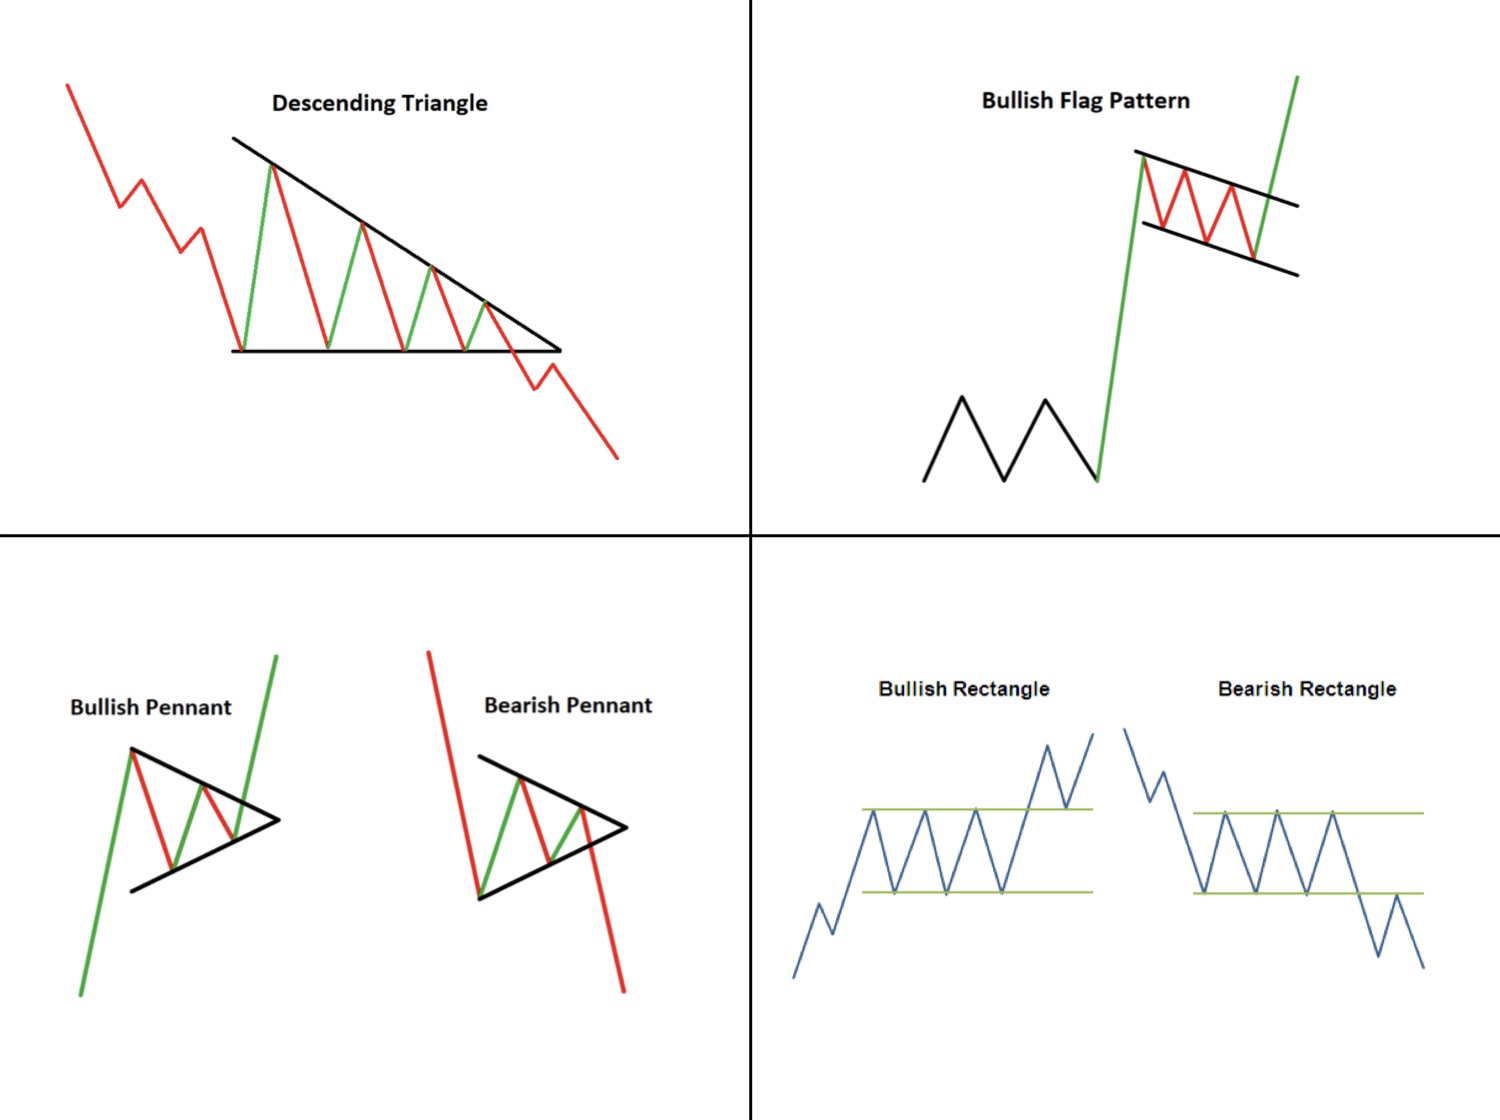
Flag and pennant patterns
These are short-term consolidation patterns that occur after a strong price movement, flags and pennants.
Flags form when price moves within a parallel channel that slopes slightly against the prevailing trend. The breakout typically follows the original trend direction.
Pennants are characterized by converging trendlines, forming a small symmetrical triangle. Unlike flags, they do not have a defined slope but still indicate continuation.
Both of them only become valid when the price breaks out with more volume, which confirms the start of the next trend. These formations are closely watched by traders for potential high probability trade setups.
Ascending and descending triangles
Triangles are patterns of market indecision which usually precede a continuation in the existing trend.
Ascending triangles feature a flat resistance level with higher lows, signaling that buyers are gaining strength. A breakout above resistance confirms the continuation of an uptrend.
Descending triangles show a flat support level with lower highs, indicating that sellers are in control. A breakdown below support confirms bearish continuation.
Rectangles (Price channels)
When the price moves sideways between two parallel support and resistance levels, a rectangle pattern forms. Rectangles are considered continuation patterns, unlike other patterns; they show a temporary balance between buyers and sellers before the market resumes its trend.
Bullish rectangles appear during an uptrend, where price consolidates within a horizontal range before breaking higher.
Bearish rectangles form in a downtrend, with price trading within a defined range before breaking lower.
These patterns are further confirmed by volume, which is an important factor. Continuation is more likely with a breakout that has strong volume, whereas a breakout with weak volume may be a false breakout. Traders typically step in after the breakout and place their stop-loss orders below the support level for bullish setups or above the resistance level for bearish setups.
Cup and handle
The cup-and-handle is a bullish continuation pattern primarily found in stock markets. It consists of two phases:
The cup forms as price gradually declines and then recovers, creating a rounded bottom.
The handle appears as price consolidates in a smaller range before breaking out.
A breakout above the handle’s resistance continues the trend. This pattern is widely followed because of historical reliability, especially in equities with strong fundamentals.
Analyzing Continuation Patterns using market data
Identifying trend continuation patterns is only half the battle. To trade them effectively, data confirmation is essential. Relying solely on price formations without deeper analysis can lead to false breakouts, unnecessary losses, and missed opportunities.
Volume as a confirmation tool
A breakout without a strong volume is like a weak handshake that will not grab your attention. When price breaks out of a continuation pattern, traders look for a surge in volume to validate the move. For example, in a bullish flag, higher-than-average volume on the breakout suggests institutional buying. However, low volume may lead to hesitation and this in turn may result in a failed move.
From the data gathered from TradingView and MT5, it is evident that continuation patterns that break with at least 30% higher volume than the 50-day average tend to have a higher follow through rate. This supports the idea that volume is a key component in pattern trading.
Momentum indicators: RSI and MACD
Volume alone is not enough. To assess the trend strength, traders usually use it in combination with momentum indicators like Relative Strength Index (RSI) and Moving Average Convergence Divergence (MACD).
RSI above 50 during the consolidation shows that the bullish momentum is still intact. MACD crossover post-breakout adds further confirmation, signaling increased buying pressure.
Risk management
Even with a very good understanding of trend continuation patterns, risk management is the main key between successful trading and losing money. A lot of traders are able to identify trends and patterns correctly but still lose money due to poor risk management.
False breakouts and fake signals
Not every breakout leads to a sustained trend continuation. False breakouts are when the price moves through the pattern’s boundaries for a very short time and then moves sharply in the opposite direction. Those who trade without waiting for the confirmation and enter the market prematurely can be often wrong.
So, how to avoid this? Confirm it first. You should look for a retest of the breakout level, or validation from indicators like the RSI and MACD before entering a trade on any given setup. There are also many experienced traders who will use higher timeframes to back up the breakout that they are seeing on a lower timeframe chart.
Poor stop-loss placement
Setting the stop-loss levels too close will make you get stopped out very frequently due to the normal price movements. However, a stop loss placed too far away from the price can lead to large losses. The best approach? Try using Average True Range (ATR) or previous support/resistance levels to find a reasonable stop loss distance.
Overleveraging and ignoring position sizing
Even a rock-solid setup can break if you are risking too much. Overleveraging increases potential returns but also the potential losses – wiping accounts out quickly. Instead, professionals follow the 1-2% risk rule, which prevents any single trade from causing significant damage.
Conclusion
Trend continuation patterns are a very useful tool in technical analysis that can help the traders to find high probable setups in the trending markets. These include flags, pennants, triangles, rectangles, and the cup-and-handle, among others, and they offer a graphical way to identify where the market is likely to move next. However, this is only half the story since recognizing the pattern is not the entire story — confirmation, risk management, and the analysis of the market environment are equally important to make a profitable trade.
Many traders make the mistake of relying solely on chart patterns without considering volume confirmation, momentum indicators, or fundamental factors driving the trend. This can lead to false breakouts and unnecessary losses. Successful traders take a disciplined approach, waiting for strong volume confirmation, ensuring proper stop placement, and managing position sizes effectively. A breakout without volume? A signal to be cautious. Overleveraging? A fast way to drain an account.