Top 10 forex indicators
Technical indicators are essential tools that help traders analyze price movements, identify trends, and predict potential market reversals. These indicators use historical price data to generate signals, offering traders a systematic approach to decision-making. By reducing emotional biases, they provide objective insights into market behavior, allowing traders to spot trading opportunities with greater confidence.
Indicators can be categorized into different types, such as trend-following, momentum, volatility, and volume indicators. They assist traders in recognizing optimal entry and exit points, identifying overbought or oversold conditions, and confirming the strength of a trend. This makes them indispensable, whether you are a day trader, swing trader, or long-term investor.
- Moving Average (MA)
Moving Averages (MAs) are among the most widely used technical indicators in forex trading. They help traders smooth out price data by calculating the average price over a specific period, reducing short-term fluctuations and providing a clearer view of the overall market trend. The two main types of moving averages are the Simple Moving Average (SMA) and the Exponential Moving Average (EMA).
The SMA calculates the average price over a fixed period, treating all data points equally. In contrast, the EMA gives more weight to recent price data, making it more responsive to current market conditions. Both are effective in helping traders identify trends, but the EMA is often preferred in fast-moving markets due to its ability to react quickly to price changes.
- Relative Strength Index (RSI)
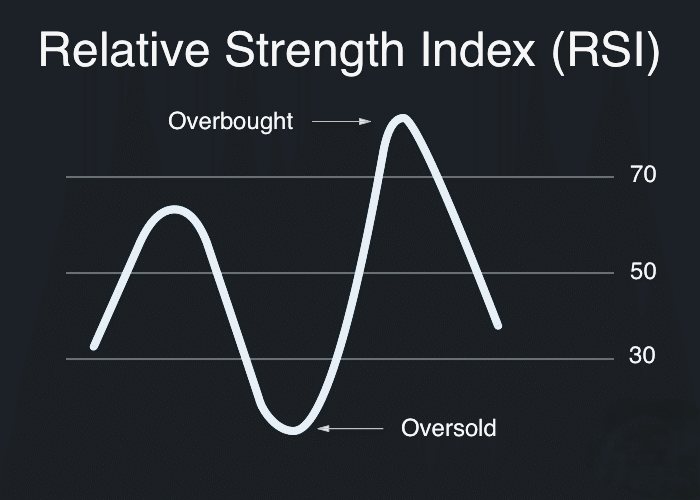
The Relative Strength Index (RSI) is a popular momentum oscillator that helps traders assess the speed and change of price movements in the forex market. The RSI measures the strength of a currency pair’s price relative to itself over a set period, typically 14 days. The resulting value ranges from 0 to 100 and is plotted on a separate chart beneath the price data, offering insights into whether a currency pair is overbought or oversold.
The RSI is widely used to identify overbought and oversold conditions. When the RSI crosses above 70, it suggests that the currency pair may be overbought, indicating that a potential reversal or correction could be on the horizon. Conversely, when the RSI falls below 30, it signals that the currency may be oversold, suggesting a possible buying opportunity as prices could rebound.

- Moving Average Convergence Divergence (MACD)
The Moving Average Convergence Divergence (MACD) is a widely used trend-following momentum indicator that helps traders assess the strength and direction of a market trend. Developed by Gerald Appel, the MACD is designed to identify changes in the momentum of a currency pair by tracking the relationship between two moving averages.
The MACD consists of three key components: the MACD line, the signal line, and the histogram. The MACD line is calculated by subtracting the 26-period Exponential Moving Average (EMA) from the 12-period EMA. The signal line is a 9-period EMA of the MACD line and serves as a trigger for buy or sell signals. The histogram represents the difference between the MACD and the signal line, providing a visual representation of the momentum's strength.
- Bollinger Bands
Bollinger Bands are a versatile volatility indicator that help traders analyze price fluctuations and identify potential breakout opportunities. This indicator consists of three lines: a simple moving average (SMA) in the middle, and two outer bands that are set at a distance of two standard deviations away from the SMA. The upper and lower bands expand and contract based on the market’s volatility, providing valuable insights into price behavior.
The main function of Bollinger Bands is to measure market volatility. When the bands are wide apart, it signals high volatility, while narrow bands suggest low volatility and a consolidation phase. Traders often use Bollinger Bands to detect potential price breakouts. For instance, when the price moves toward or beyond the upper band, it may indicate an overbought market, while touching or falling below the lower band can signal an oversold condition.
- Fibonacci Retracement
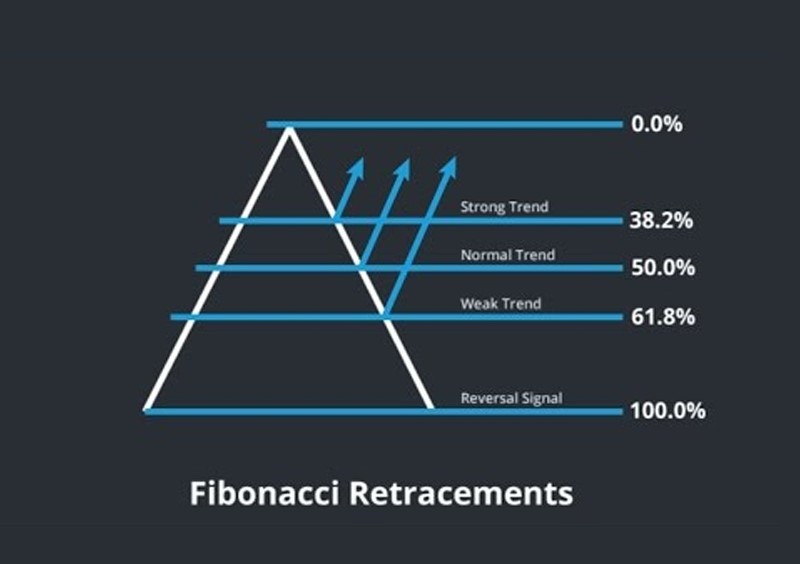
Fibonacci retracement is a widely used tool in forex trading, based on the mathematical ratios derived from the Fibonacci sequence. These ratios—23.6%, 38.2%, 50%, and 61.8%—are applied to a price chart to identify potential support and resistance levels where price movements may pause or reverse. Fibonacci retracements are calculated by measuring the vertical distance between a significant price high and low, then applying the key ratios to project levels where the price might retrace before continuing its original trend.
Traders often use Fibonacci retracement to gauge areas where market pullbacks may occur within a prevailing trend. For example, in an uptrend, the retracement tool can help traders predict where a temporary price correction might end, giving them potential entry points before the market resumes its upward movement. Similarly, in a downtrend, Fibonacci retracement can highlight levels where a corrective rally might encounter resistance.

- Stochastic Oscillator
The Stochastic Oscillator is a popular momentum indicator used in forex trading to compare a currency pair's closing price to its price range over a specified period. The Stochastic Oscillator measures the relationship between the closing price and the high-low range, typically over a 14-period time frame. The result is a value between 0 and 100, which helps traders identify the strength of price momentum and potential reversals.
The Stochastic Oscillator is particularly effective in identifying overbought and oversold conditions. A reading above 80 signals that the currency pair may be overbought, suggesting a possible price correction or reversal. Conversely, a reading below 20 indicates an oversold market, where a rebound may be likely. These signals provide valuable insights into potential entry or exit points, especially in ranging markets where price tends to oscillate between support and resistance levels.
- Ichimoku Cloud (Ichimoku Kinko Hyo)
The Ichimoku Cloud, also known as Ichimoku Kinko Hyo, is a comprehensive indicator that provides a detailed view of support, resistance, trend direction, and momentum. Developed by Japanese journalist Goichi Hosoda, the Ichimoku Cloud consists of five key components: Tenkan-sen, Kijun-sen, Senkou Span A, Senkou Span B, and Chikou Span.
- Tenkan-sen (conversion line) is the midpoint of the highest high and lowest low over the last nine periods, and it helps identify short-term trends.
- Kijun-sen (baseline) is the midpoint over the last 26 periods and serves as a stronger trend indicator.
- Senkou Span A and Senkou Span B form the "cloud" (Kumo), projecting future support and resistance levels. The space between them creates the cloud, where a price above it indicates an uptrend, and below it signals a downtrend.
- Chikou Span (lagging line) is the current closing price plotted 26 periods in the past, helping traders confirm trends.
The Ichimoku Cloud offers a comprehensive view of the market by combining these components. It shows trend direction, potential reversal points, and support/resistance zones at a glance. When the price is above the cloud, it suggests a strong uptrend, while price below the cloud indicates a downtrend.
- Average True Range (ATR)
The Average True Range (ATR) is a widely-used volatility indicator. It helps traders measure market volatility by calculating the average range between the high and low price of an asset over a specified period. Unlike other indicators, ATR does not indicate trend direction but focuses solely on the degree of price movement, making it particularly useful for gauging market volatility in both trending and ranging markets.
The ATR is calculated by taking the greatest value of three possible price ranges: the difference between the current high and low, the difference between the current high and the previous close, and the difference between the current low and the previous close. This calculation produces a figure that represents the average true range of price movements over a given period, typically 14 days.
- Parabolic SAR (stop and reverse)
The Parabolic SAR (Stop and Reverse) is a trend-following indicator that helps traders identify potential reversals in price direction. The indicator is visually represented by a series of dots that appear above or below price action on a chart. These dots change position based on the movement of the price, signaling a shift in market trends.
The primary function of the Parabolic SAR is to provide traders with clear signals for when a trend might be ending or reversing. When the dots are positioned below the price, it indicates an uptrend, while dots above the price suggest a downtrend. A change in the position of the dots—from above to below or vice versa—signals a potential reversal, prompting traders to consider exiting a position or entering in the opposite direction.
- Commodity Channel Index (CCI)
The Commodity Channel Index (CCI) is a momentum-based indicator developed by Donald Lambert that helps traders identify price reversals and overbought or oversold market conditions. Though initially designed for commodities trading, the CCI has since been widely adopted in forex and other financial markets. It measures the deviation of a currency pair’s price from its average statistical mean over a specified period, offering insights into market momentum.
The CCI oscillates between positive and negative values, with readings typically ranging from +100 to -100. A CCI value above +100 suggests that the asset may be overbought, indicating a potential reversal or correction in price. Conversely, a CCI value below -100 signals an oversold condition, suggesting that the price might rebound or reverse to the upside.
Conclusion
Technical indicators play a crucial role in helping forex traders make informed decisions by providing insights into price trends, momentum, volatility, and potential reversals. Each indicator serves a specific purpose, whether it’s identifying entry and exit points, gauging market sentiment, or confirming trends. By using a combination of indicators, traders can reduce noise, enhance the accuracy of their predictions, and develop more robust trading strategies.
However, no single indicator is perfect, and the effectiveness of an indicator may vary depending on market conditions and the trader’s style. For this reason, it’s essential to test and combine multiple indicators to find a setup that suits your unique trading approach.


