Top 10 Candlestick Patterns for forex traders
Candlestick patterns hold a crucial place in the realm of forex trading, serving as a powerful tool for traders to interpret market sentiment and make informed decisions. These patterns, which visually represent price movements over a specific period, help traders identify potential market reversals and continuations. By understanding the formation and implications of various candlestick patterns, traders can gain insights into the underlying market dynamics, improving their chances of successful trades.
The history of candlestick charting dates back to 18th century Japan, where it was developed by Munehisa Homma, a rice trader from Sakata. Homma's innovative approach to charting price movements laid the foundation for modern candlestick analysis. His methods were later refined and popularized in the Western world by Steve Nison in the late 20th century, bringing candlestick patterns to the forefront of technical analysis in financial markets.
Understanding Candlestick Patterns
Candlestick patterns are a type of price chart used in technical analysis to display the high, low, open, and close prices of a security over a specific period. Unlike traditional bar charts, candlestick charts provide a visual representation that makes it easier to understand market sentiment and potential price movements. Each candlestick consists of three main components: the body, the wick (or shadow), and the tails.
The body of the candlestick represents the difference between the opening and closing prices. A green (or white) body indicates a price increase, where the closing price is higher than the opening price. Conversely, a red (or black) body signifies a price decrease, where the closing price is lower than the opening price. The wick, also known as the shadow, extends above and below the body, showing the highest and lowest prices during the trading period.
Candlesticks effectively capture market sentiment by visually displaying the battle between buyers (bulls) and sellers (bears). A long body suggests strong buying or selling pressure, depending on its color, while a short body indicates indecision or a lack of significant price movement. Similarly, long wicks can signal volatility and potential reversals, reflecting the high and low extremes of the trading session. By interpreting these patterns, traders can gain insights into market psychology, helping them anticipate potential price movements and make more informed trading.
Bullish reversal patterns
Bullish reversal patterns are candlestick formations that indicate a potential change in the market's direction from a downtrend to an uptrend. These patterns signal that buying pressure is starting to outweigh selling pressure, suggesting an impending rise in prices.
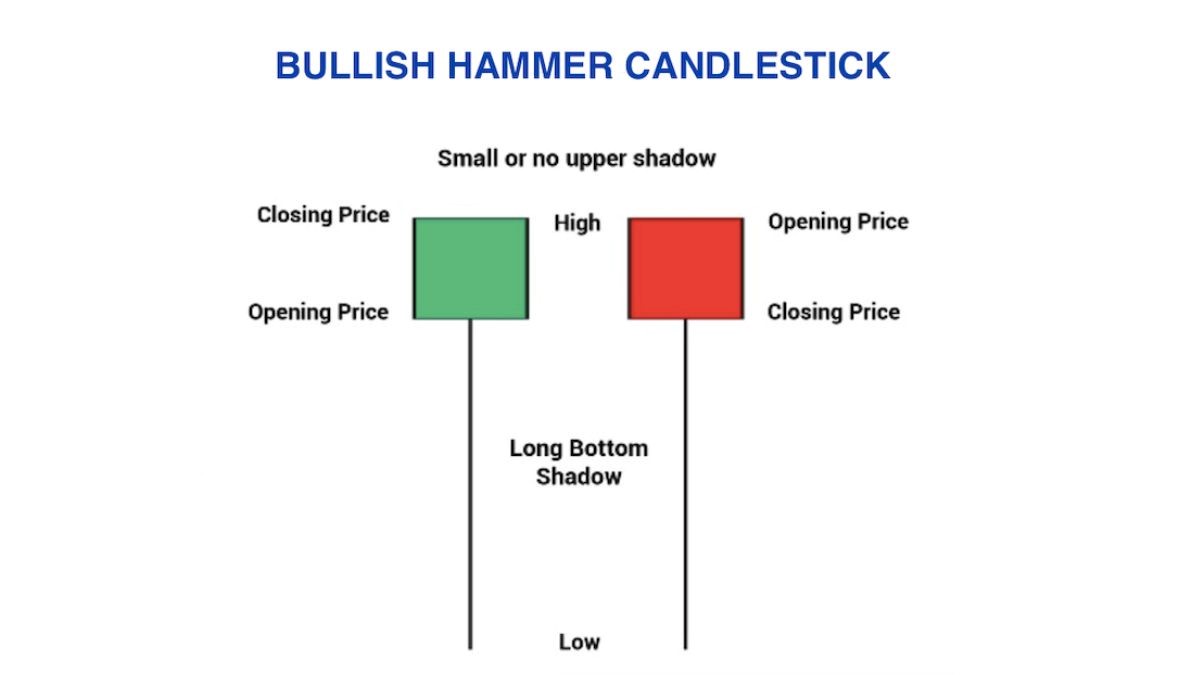
Hammer
A hammer is characterized by a small body at the upper end of the trading range, with a long lower wick. It appears after a downtrend and signals a potential reversal. The long lower wick indicates that sellers drove prices down during the session, but strong buying pressure pushed the price back up, closing near the opening price. This suggests a shift from selling to buying momentum.
Example: After several days of declining prices, a hammer forms at the bottom of a downtrend, indicating that buyers are entering the market and a reversal may occur.
Inverted Hammer
An inverted hammer has a small body at the lower end of the trading range with a long upper wick. It also appears after a downtrend and signals a potential reversal. The long upper wick shows that buyers tried to push prices higher during the session, but sellers regained control, driving prices back down. However, the buying attempt indicates growing bullish sentiment.
Example: Following a series of bearish candles, an inverted hammer forms, suggesting that although sellers are still present, buying interest is increasing.
Bullish Engulfing
A bullish engulfing pattern occurs when a small bearish candle is followed by a larger bullish candle that completely engulfs the previous candle's body. The larger bullish candle shows a strong shift in sentiment from selling to buying, as buyers overwhelm sellers.
Example: During a downtrend, a small bearish candle is followed by a large bullish candle, indicating a potential reversal as buying pressure gains strength.
Morning Star
A morning star is a three-candle pattern that starts with a long bearish candle, followed by a small-bodied candle (indicating indecision), and ends with a long bullish candle. The initial bearish candle shows strong selling, the middle candle reflects indecision, and the final bullish candle indicates that buyers are taking control.
Example: After a prolonged downtrend, a morning star forms, signaling that the downtrend is losing momentum and a bullish reversal is likely.
Piercing Line
The piercing line pattern involves a long bearish candle followed by a bullish candle that opens below the previous candle’s low but closes above its midpoint. This pattern indicates that sellers initially drove prices lower, but buyers stepped in forcefully, pushing prices up and signaling a potential trend reversal.
Example: In a downtrend, a long bearish candle is followed by a bullish candle that closes above the midpoint of the previous candle, suggesting that the selling pressure is weakening and a reversal is possible.
Bearish reversal patterns
Bearish reversal patterns are candlestick formations that indicate a potential change in the market's direction from an uptrend to a downtrend. These patterns signal that selling pressure is starting to outweigh buying pressure, suggesting an impending decline in prices.
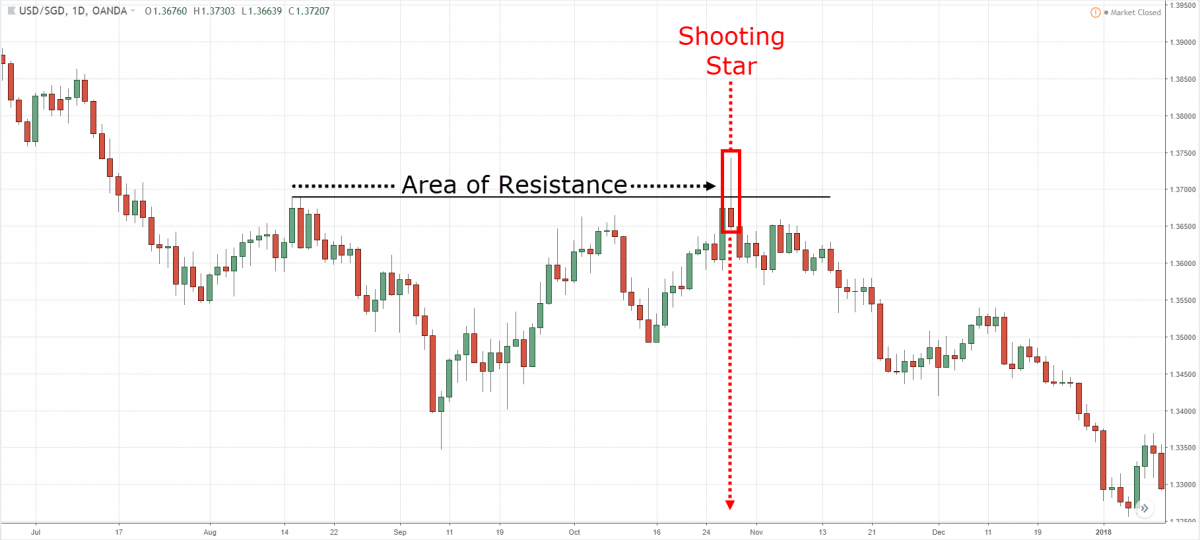
Shooting Star
A shooting star is characterized by a small body at the lower end of the trading range with a long upper wick. It appears after an uptrend and signals a potential reversal. The long upper wick indicates that buyers drove prices higher during the session, but strong selling pressure pushed the price back down, closing near the opening price. This suggests a shift from buying to selling momentum.
Example: After several days of rising prices, a shooting star forms at the top of an uptrend, indicating that sellers are entering the market and a reversal may occur.
Hanging Man
A hanging man has a small body at the upper end of the trading range with a long lower wick. It also appears after an uptrend and signals a potential reversal. The long lower wick shows that sellers tried to push prices lower during the session, but buyers regained control, driving prices back up. However, the selling attempt indicates growing bearish sentiment.
Example: Following a series of bullish candles, a hanging man forms, suggesting that although buyers are still present, selling interest is increasing.
Bearish Engulfing
A bearish engulfing pattern occurs when a small bullish candle is followed by a larger bearish candle that completely engulfs the previous candle's body. The larger bearish candle shows a strong shift in sentiment from buying to selling, as sellers overwhelm buyers.
Example: During an uptrend, a small bullish candle is followed by a large bearish candle, indicating a potential reversal as selling pressure gains strength.
Evening Star
An evening star is a three-candle pattern that starts with a long bullish candle, followed by a small-bodied candle (indicating indecision), and ends with a long bearish candle. The initial bullish candle shows strong buying, the middle candle reflects indecision, and the final bearish candle indicates that sellers are taking control.
Example: After a prolonged uptrend, an evening star forms, signaling that the uptrend is losing momentum and a bearish reversal is likely.
Dark Cloud Cover
The dark cloud cover pattern involves a long bullish candle followed by a bearish candle that opens above the previous candle’s high but closes below its midpoint. This pattern indicates that buyers initially drove prices higher, but sellers stepped in forcefully, pushing prices down and signaling a potential trend reversal.
Example: In an uptrend, a long bullish candle is followed by a bearish candle that closes below the midpoint of the previous candle, suggesting that the buying pressure is weakening and a reversal is possible.
Combining Candlestick Patterns with other indicators
Candlestick patterns are powerful tools for identifying potential market reversals and continuations, but relying solely on them can lead to false signals. To increase the reliability of these patterns, it is crucial to combine them with other technical indicators. This approach provides confirmation and helps traders make more informed decisions.
Moving Averages
Moving averages smooth out price data, providing a clearer picture of the underlying trend. When a candlestick pattern forms near a moving average, it can signal a stronger reversal or continuation. For example, a bullish engulfing pattern near a 50-day moving average may indicate a more reliable buying opportunity.
Relative Strength Index (RSI)
The Relative Strength Index measures the speed and change of price movements, indicating overbought or oversold conditions. When a candlestick pattern forms in conjunction with an RSI reading below 30 (oversold) or above 70 (overbought), it can confirm a potential reversal. For instance, a hammer pattern at an RSI of 25 suggests a strong buy signal.
Fibonacci Retracement
Fibonacci retracement levels identify potential support and resistance levels based on the Fibonacci sequence. Candlestick patterns that form at key Fibonacci levels (e.g., 38.2%, 50%, 61.8%) can provide robust confirmation. A piercing line pattern at the 50% retracement level, for instance, may indicate a strong buying opportunity.
MACD
The Moving Average Convergence Divergence (MACD) indicator shows the relationship between two moving averages of a security’s price. When a candlestick pattern aligns with a bullish or bearish MACD crossover, it reinforces the signal. For example, a morning star pattern coupled with a MACD bullish crossover can suggest a strong upward momentum.
Conclusion
Candlestick patterns are an indispensable tool in the arsenal of any forex trader. They provide clear and visually intuitive signals that can indicate potential market reversals and continuations. By understanding and interpreting these patterns, traders gain valuable insights into market sentiment and the underlying forces driving price movements. This ability to anticipate market changes can significantly enhance a trader's decision-making process, leading to more timely and profitable trades.