Rate of change indicator
The rate of change (ROC) indicator is a widely utilized momentum oscillator in forex trading, offering valuable insights into the speed and magnitude of price movements over a specific period. By analyzing price changes, the ROC indicator helps traders identify the strength of a trend and potential reversal points, making it an essential tool for those aiming to maximize trading opportunities.
At its core, the ROC indicator measures the percentage change between the current price and a past price, producing a line that fluctuates above and below a zero baseline. This dynamic makes it particularly useful for spotting bullish or bearish momentum, as well as for confirming the direction of ongoing trends. Unlike lagging indicators, which react to past price movements, the ROC provides a more immediate reflection of market sentiment, aiding traders in making timely decisions.
Forex traders leverage the ROC indicator in various ways, from determining entry and exit points to combining it with other technical tools to enhance the reliability of their analysis. For instance, when used alongside moving averages or support and resistance levels, the ROC can help validate trading signals, reducing the risk of false predictions.
What is the rate of change indicator?
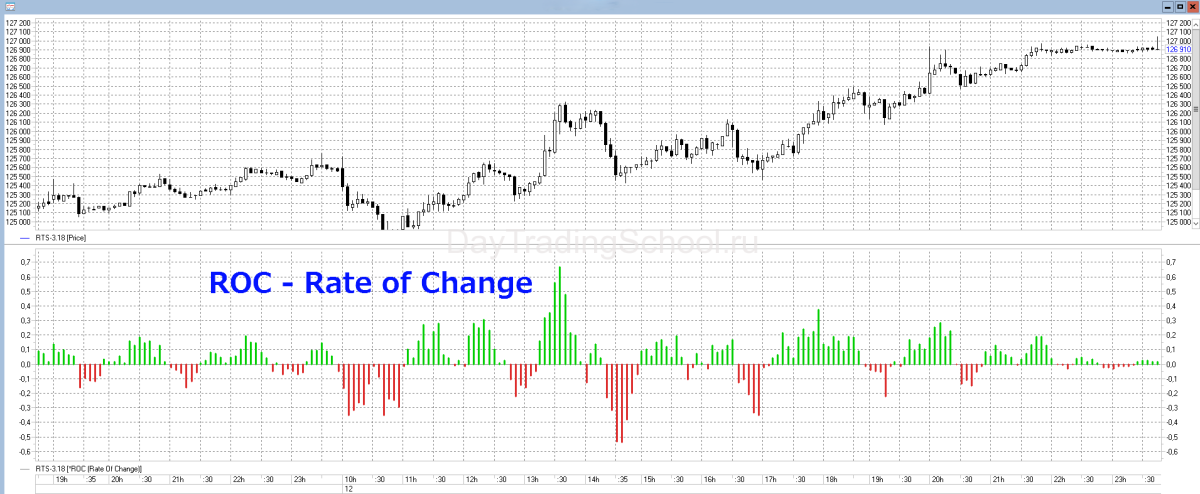
The rate of change (ROC) indicator is a momentum-based tool that evaluates the velocity of price changes in the forex market. It calculates the percentage difference between the current price and the price from a specific number of periods ago. This value is plotted as a line that oscillates around a zero baseline, offering insights into market momentum and the strength of price movements.
The mathematical formula for the ROC is:
[(Current Price - Price n periods ago) / Price n periods ago)] x 100
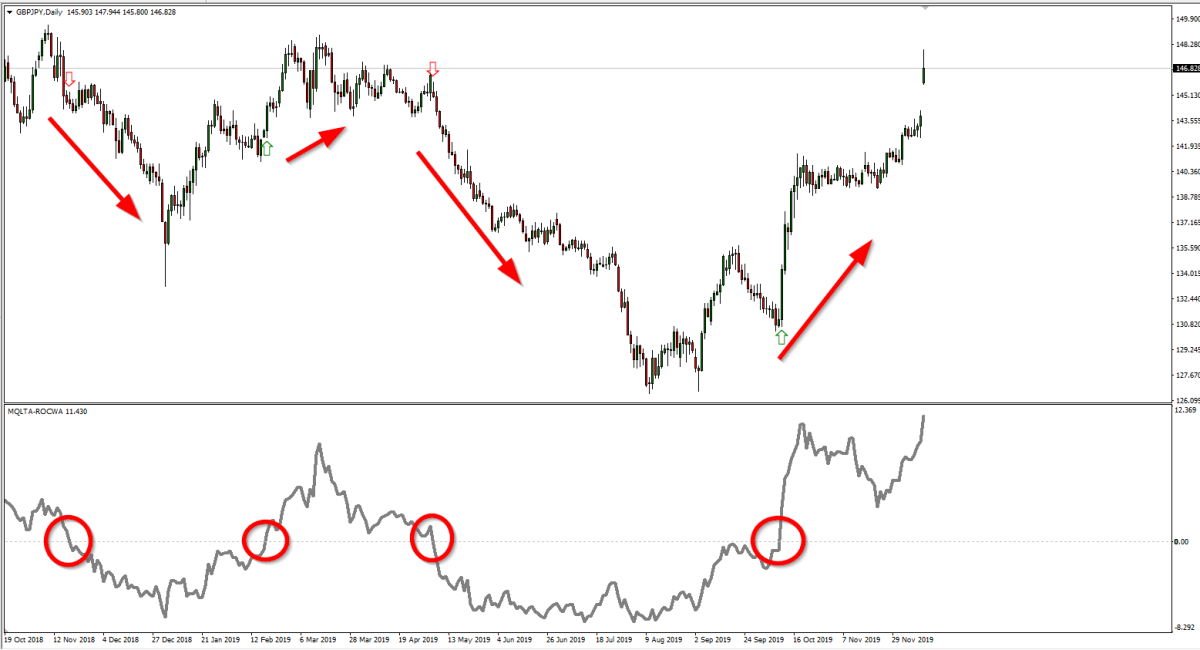
This formula highlights how the ROC measures the relative change in price, expressed as a percentage. Positive values suggest upward momentum, while negative values indicate downward momentum. When the ROC crosses above or below the zero line, it signals potential shifts in trend direction.
Traders often compare the ROC to other popular momentum indicators like the Relative Strength Index (RSI) and the Moving Average Convergence Divergence (MACD). While the RSI focuses on overbought and oversold conditions and the MACD emphasizes trend and momentum, the ROC provides a unique perspective by quantifying the speed of price changes directly.
The ROC is versatile and can be applied across various timeframes, from intraday charts to long-term analysis. Its responsiveness makes it particularly effective in dynamic markets, where quick shifts in momentum are common. However, traders must carefully interpret ROC signals and consider additional tools for confirmation, as abrupt market movements can sometimes produce misleading spikes.

How to use the Rate of Change indicator in forex trading
The rate of change (ROC) indicator is a versatile tool that provides traders with insights into market momentum, helping to identify trends, reversals, and trading opportunities. Properly interpreting its signals can significantly enhance trading strategies.
One primary use of the ROC indicator is to assess momentum through its oscillating line. When the ROC is positive and rising, it indicates strong upward momentum, suggesting a bullish trend. Conversely, a negative and falling ROC points to downward momentum, signaling a bearish trend. Traders often pay close attention to the zero-line crossover. A move above the zero line typically indicates the beginning of an uptrend, while a move below signals a potential downtrend.
Another powerful application is spotting overbought and oversold market conditions. For example, when the ROC reaches extreme highs, it may suggest the market is overbought, potentially foreshadowing a price correction. Similarly, extreme lows can indicate oversold conditions, hinting at a possible price recovery.
Divergences between the ROC and price action can also serve as a predictive tool. When prices form higher highs, but the ROC forms lower highs, it indicates weakening momentum and a potential reversal. The opposite holds true for lower lows in price and higher lows in the ROC.
Building a Rate of Change indicator strategy
Developing a rate of change (ROC) indicator strategy involves combining its momentum-tracking capabilities with other tools and techniques to create a comprehensive approach to forex trading. The ROC alone can provide valuable insights, but when paired with additional indicators, it becomes a powerful component of a robust trading system.
Identifying trends
A common starting point is to use the ROC to identify prevailing trends. For example, if the ROC consistently remains above the zero line, it signals bullish momentum, indicating an uptrend. Conversely, when it stays below zero, bearish momentum prevails. Traders can use this information to align their trades with the dominant market direction.
Setting entry and exit points
The ROC is effective for timing entry and exit points. For instance, an upward crossover above the zero line may indicate a buying opportunity, while a downward crossover could signal a sell. Additionally, traders often watch for extreme highs or lows in the ROC, suggesting overbought or oversold conditions where reversals might occur.
Confirming signals
To reduce false signals, traders frequently combine the ROC with other indicators. For example:
- Pairing the ROC with moving averages to confirm trend direction.
- Using Bollinger Bands to identify potential breakout points when ROC momentum aligns with price movements.
- Employing support and resistance levels to validate ROC signals near key price zones.
Risk management and backtesting
Every strategy involving the ROC should include well-defined stop-loss and take-profit levels. Backtesting strategies on historical data is essential to gauge their effectiveness and refine parameters for optimal performance in live markets.
Rate of Change indicator in popular trading platforms
The rate of change (ROC) indicator is a standard feature in most trading platforms, including MetaTrader 4 (MT4), TradingView, and NinjaTrader, each offering unique functionalities and customization options. Understanding how to access and utilize the ROC on these platforms can help traders streamline their analysis and improve decision-making.
Using the Rate of Change indicator on MT4
The rate of change MT4 indicator is accessible directly within the platform or as a custom plugin. To apply it, traders can:
- Open the MT4 platform and select “Insert” > “Indicators” > “Custom.”
- Choose the ROC indicator and adjust settings such as the number of periods.
- Overlay the ROC line on price charts to analyze momentum shifts and potential trend reversals.
MT4’s customization options allow traders to modify period lengths, colors, and display settings, tailoring the indicator to suit individual trading styles and timeframes.
Using the ROC indicator on TradingView
TradingView offers advanced visualization tools and a user-friendly interface for ROC analysis. Traders can add the ROC indicator through the “Indicators” menu and utilize its built-in features like multi-timeframe analysis and the ability to combine indicators on one chart. TradingView also enables traders to save customized ROC templates for repeated use.
Insights for NinjaTrader users
NinjaTrader provides in-depth ROC customization and scripting capabilities for advanced users. The platform supports strategy automation based on ROC signals, allowing traders to test and deploy rule-based systems.

Advantages and limitations of the Rate of Change indicator
Advantages
- Momentum Tracking: The ROC excels at measuring the speed and direction of price changes, helping traders identify the strength of a trend. Its simplicity makes it an accessible tool for traders of all experience levels.
- Early Signals: By detecting shifts in momentum, the ROC can provide early warnings of potential trend reversals or continuations. This makes it useful for timing entry and exit points.
- Flexibility: The ROC is versatile and can be applied across different timeframes, catering to both short-term traders and long-term investors.
- Ease of Use: Unlike complex indicators, the ROC uses a straightforward formula, making it easy to interpret when integrated into trading strategies.
Limitations
- False Signals: In volatile or choppy markets, the ROC may produce misleading spikes, leading to false buy or sell signals.
- Lag in Long Timeframes: While shorter periods make the ROC highly responsive, longer periods may lag, reducing its effectiveness in fast-moving markets.
- Standalone Use: Relying solely on the ROC can be risky. It is most effective when combined with other technical tools, such as moving averages or support and resistance levels.
- No Fundamental Insights: The ROC is purely technical and does not account for macroeconomic or geopolitical factors that influence price movements.
Conclusion
The rate of change (ROC) indicator stands out as a powerful tool in forex trading, offering traders a straightforward way to assess momentum and price dynamics. By measuring the percentage change in price over a specific period, the ROC enables traders to identify trends, spot potential reversals, and make informed trading decisions. Its simplicity and adaptability make it suitable for various trading styles, from scalping to long-term investing.
One of the greatest strengths of the ROC lies in its ability to signal early shifts in market sentiment. Positive readings suggest bullish momentum, while negative readings point to bearish tendencies. These insights, combined with zero-line crossovers and divergence analysis, provide traders with actionable signals. However, the ROC’s effectiveness increases significantly when used in conjunction with other technical indicators, such as moving averages or support and resistance levels, to confirm its findings.
Despite its advantages, traders must remain aware of the ROC’s limitations. It can produce false signals in volatile markets and lacks the ability to account for external factors like economic data or geopolitical events. As such, a balanced approach that integrates technical, fundamental, and risk management strategies is essential for success.


