Price Action Trend Line strategy
Price action is the study of historical price movements to predict future market behavior. By analyzing patterns and structures in price charts, traders can identify key levels of support and resistance, potential reversals, and entry or exit points. Trend lines, on the other hand, are visual representations of market direction. Drawn by connecting swing highs or lows, they help traders determine the prevailing trend—whether upward, downward, or sideways—and anticipate future price behavior.
The combination of price action and trend lines creates a robust framework for making trading decisions. This strategy enables traders to spot opportunities in trending markets, such as continuation trades, or recognize reversals when a trend loses momentum. Furthermore, it simplifies the decision-making process by focusing on price as the primary indicator, allowing traders to avoid the clutter of multiple technical tools.
Basics of Price Action in forex trading
Price action is a fundamental concept in forex trading that revolves around analyzing raw price movements to understand market behavior. Unlike strategies that rely on lagging indicators, price action focuses solely on historical and current price data, providing traders with a direct and uncluttered view of the market. By interpreting price patterns and structures, traders can make decisions rooted in the supply-demand dynamics driving the forex market.
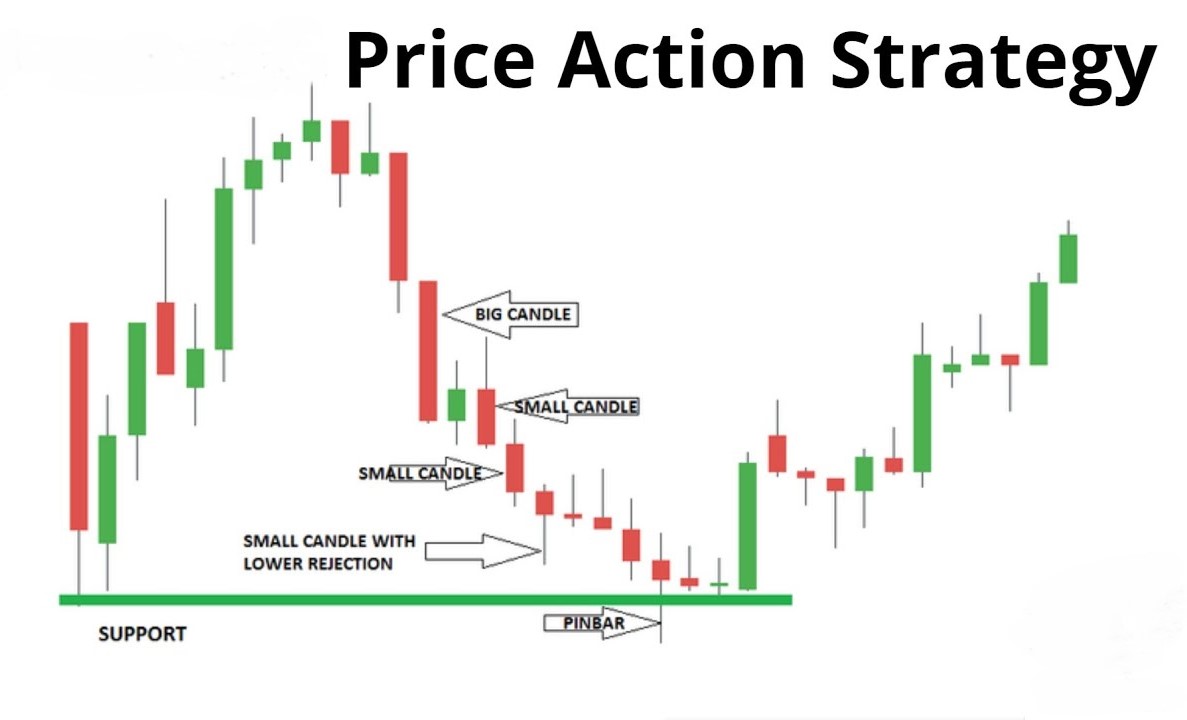
At its core, price action reflects how buyers and sellers interact in real time. Key elements include candlestick patterns, which provide critical insights into market sentiment. For instance, a pin bar with a long wick indicates a potential reversal, while an inside bar shows consolidation before a breakout. Other essential tools, such as support and resistance levels, help identify areas where price is likely to react or reverse.
One of the advantages of price action is its versatility. Traders can combine it with other tools like Fibonacci retracements or pivot points to refine their analysis. For example, a confluence of price action signals at a major Fibonacci level can provide high-probability trading opportunities.
Another critical aspect of price action is understanding market phases—trending, ranging, or consolidating. In a trending market, price typically makes higher highs and higher lows (uptrend) or lower highs and lower lows (downtrend). Recognizing these patterns enables traders to align their strategies with market conditions and avoid counterproductive trades.
Understanding Trend Lines in technical analysis
Trend lines are among the most widely used tools in technical analysis, offering traders a simple yet effective way to identify market direction and potential trading opportunities. By visually representing price trends, trend lines help traders determine whether the market is in an uptrend, downtrend, or range-bound phase. This insight is invaluable for aligning trading strategies with the prevailing market conditions.
A trend line is created by connecting at least two significant swing points—either highs or lows—on a price chart. An ascending trend line connects higher lows in an uptrend, showing that buyers are consistently stepping in at higher levels. Conversely, a descending trend line connects lower highs in a downtrend, reflecting the dominance of sellers. Horizontal trend lines, often drawn at key support or resistance levels, indicate consolidation zones where price struggles to break through.
Drawing accurate trend lines requires precision and a clear understanding of price movement. It’s important to avoid overfitting, which involves forcing a trend line to align with price points that do not naturally fit. A valid trend line typically connects at least two points, with the third point serving as confirmation. The more times price respects a trend line, the stronger its significance.
While trend lines provide valuable insights, traders must remember they are not infallible. Markets can be unpredictable, and trend lines can break or fail due to sudden news events or shifts in sentiment. By combining trend lines with other tools, such as candlestick patterns or volume analysis, traders can improve the reliability of their strategies.
How to combine Price Action with Trend Line strategies
The combination of price action and trend lines is a powerful approach for identifying high-probability trading opportunities in the forex market.
1. Analyze market structure
Before drawing any trend lines, it’s essential to evaluate the market structure. Identify whether the market is trending (uptrend or downtrend) or ranging. In a trending market, price typically moves in waves, creating higher highs and higher lows in an uptrend or lower highs and lower lows in a downtrend.
2. Draw Trend Lines
Using two or more swing points, draw a trend line to map the current direction of the market. For instance, in an uptrend, connect the higher lows to create a support trend line, while in a downtrend, connect the lower highs for a resistance trend line. Ensure the trend line is not forced and aligns naturally with price movements.
3. Identify Price Action signals at Trend Lines
Observe how price interacts with the trend line. Look for price action patterns like pin bars (indicating potential reversals), engulfing candles (signaling strong momentum), or inside bars (suggesting consolidation). These signals become even more reliable when they align with trend line touches or confluence zones.
4. Combine with confluence
Confluence strengthens the validity of a trade setup. Align the trend line with other technical levels, such as support and resistance zones, Fibonacci retracements, or pivot points.
Applications of the Price Action Trend Line Strategy
The price action trend line strategy is highly versatile and can be applied across different trading scenarios to take advantage of market opportunities. By understanding its applications, traders can effectively use this approach for trend continuation, reversals, and breakout setups.
1. Trend continuation setups
In trending markets, the price often retraces or pulls back before resuming its overall direction. Traders can use trend lines to identify these pullbacks and potential re-entry points. For example, in an uptrend, an ascending trend line acts as a support level where buyers tend to step in. Price action patterns such as bullish pin bars or engulfing candles at the trend line indicate the likelihood of a continuation.
2. Reversal setups
Reversals occur when the price breaks a well-established trend line and shows signs of a trend change. For instance, in a downtrend, a descending trend line may be broken when buyers regain control. By combining this with price action signals—such as a double bottom formation or a bullish engulfing candle—traders can confirm a potential reversal and enter the market with more confidence.
3. Breakout trades
Breakouts happen when the price breaches a trend line with strong momentum. To trade breakouts effectively, traders should wait for confirmation, such as a strong breakout candle or a retest of the broken trend line. This reduces the likelihood of entering a false breakout.
4. Timeframe flexibility
This strategy works across all timeframes. Day traders can apply it to short-term charts (e.g., 5-minute or 1-hour), while swing traders might use daily or weekly charts for broader trends.
Advantages and limitations of the Price Action Trend Line Strategy
The price action trend line strategy offers several benefits, making it a popular choice among forex traders. However, it also has limitations that traders must understand to use it effectively.
Advantages:
One of the primary benefits of this strategy is its simplicity. Unlike indicator-based approaches, the price action trend line strategy relies solely on raw price data, enabling traders to focus on the market's underlying behavior without the distraction of lagging signals. It works across all currency pairs and timeframes, offering versatility for traders with different strategies, from scalping to swing trading.
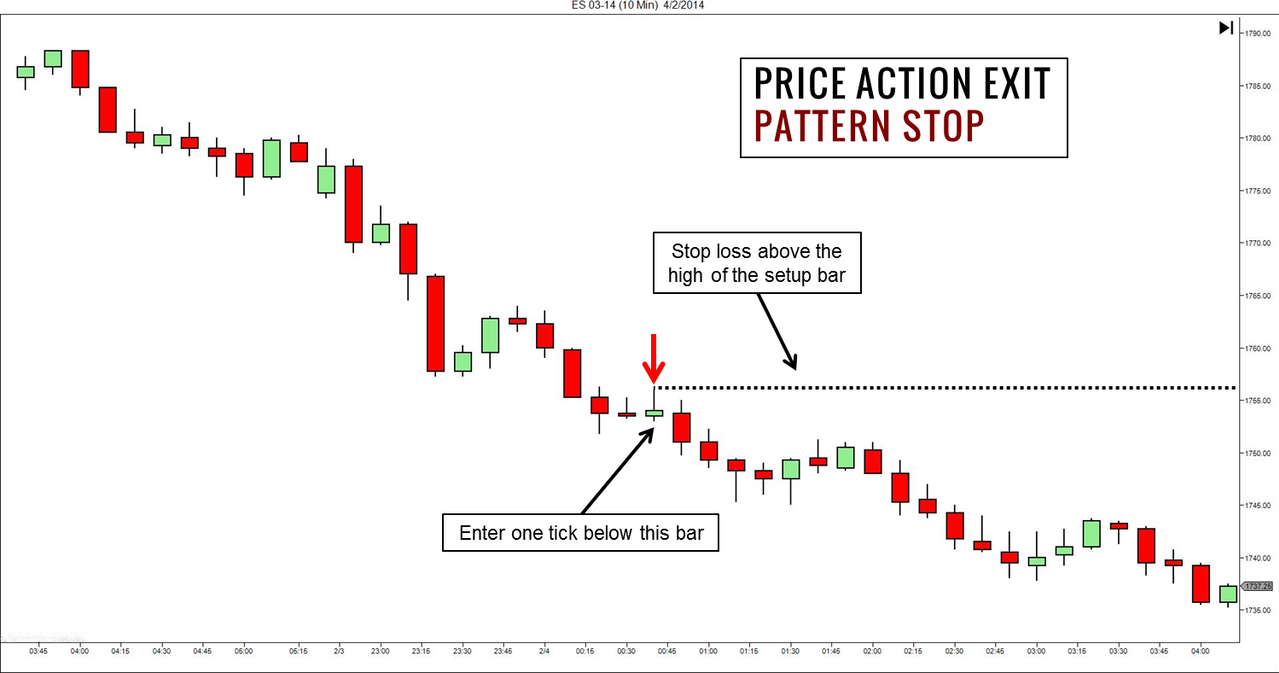
Another advantage is its ability to provide clear entry, exit, and stop-loss points. For instance, a trader can place a stop-loss just below a trend line in an uptrend or above it in a downtrend. This makes risk management straightforward. Furthermore, by combining trend lines with price action signals like pin bars or engulfing candles, traders can enhance the reliability of their setups and reduce false entries.
Limitations:
Despite its benefits, the strategy is not without challenges. Drawing trend lines is subjective, and inexperienced traders may struggle to identify valid lines, leading to inconsistent results. Additionally, markets can be unpredictable, and trend lines may fail during periods of high volatility or significant news events. Traders also need to account for false breakouts, where price briefly breaches a trend line before reversing.
Conclusion
The price action trend line strategy is a powerful tool for forex traders, offering a straightforward yet effective way to analyze market behavior and identify trading opportunities. By focusing on raw price movements and market trends, this approach eliminates the noise and lag associated with many technical indicators, enabling traders to make real-time decisions based on clear visual cues.
However, as with any strategy, the price action trend line approach comes with challenges. Subjectivity in drawing trend lines and the potential for false breakouts require traders to exercise discipline, practice extensively, and refine their skills over time. By integrating sound risk management practices—such as setting stop-loss and take-profit levels, avoiding overleveraging, and maintaining a favorable risk-to-reward ratio—traders can protect their capital and improve their consistency.
Ultimately, the success of this strategy lies in its simplicity and adaptability. It works across all timeframes and currency pairs, making it accessible for both novice and experienced traders.