Parabolic Sar indicator
In forex trading, technical analysis plays a vital role in helping traders make informed decisions by studying past market data, primarily price and volume. Unlike fundamental analysis, which focuses on economic indicators, technical analysis relies on chart patterns and technical indicators to predict future price movements. One such popular tool is the Parabolic SAR indicator.
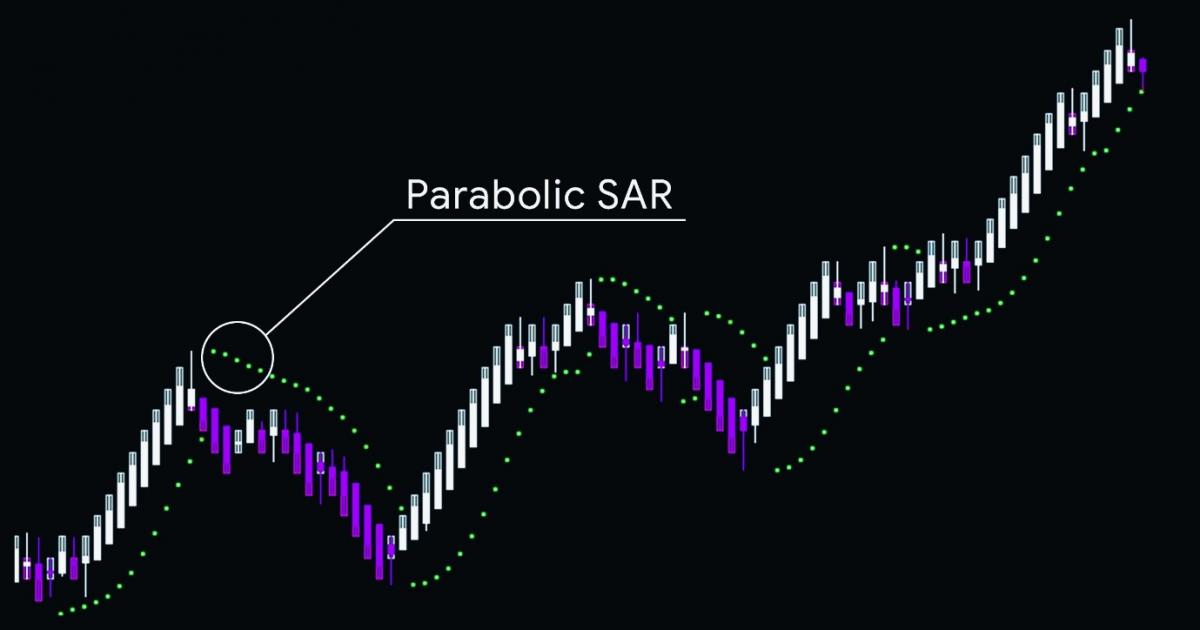
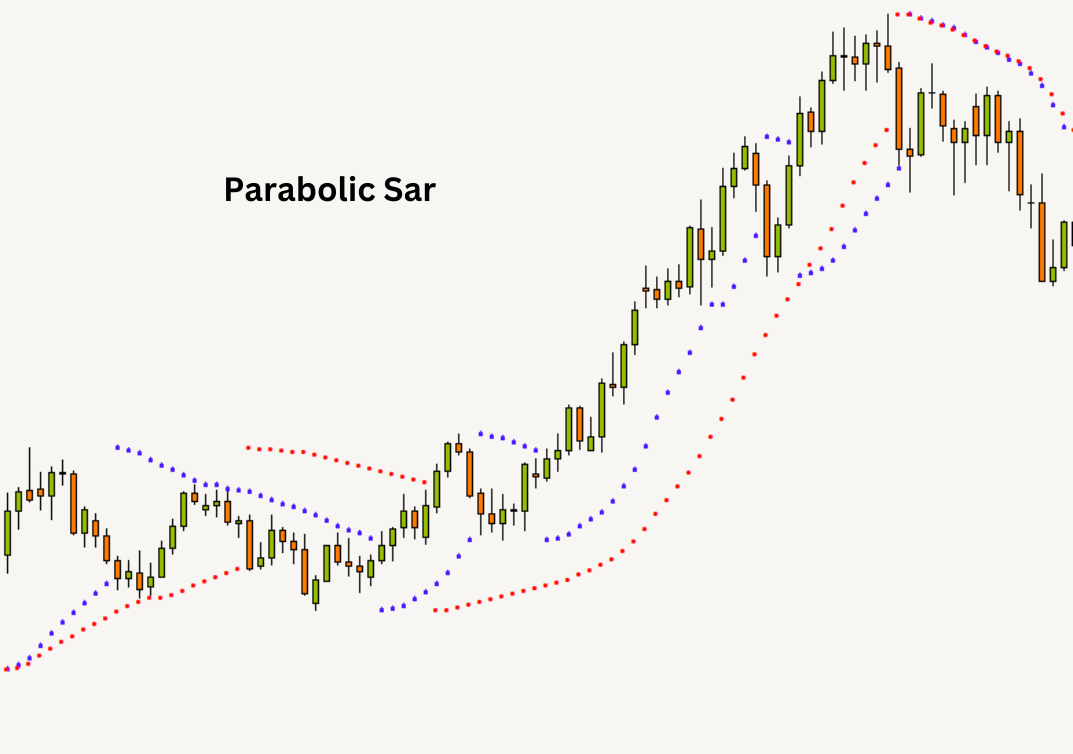
Developed by J. Welles Wilder, a renowned figure in technical analysis, the Parabolic SAR (Stop and Reverse) is a trend-following indicator designed to highlight potential reversal points in the market. It does this by plotting a series of dots on a price chart, which appear either above or below the price action. When the dots are below the price, it signals a bullish trend; when they are above, it indicates a bearish trend.
The primary purpose of the Parabolic SAR is to assist traders in identifying the current market trend and pinpointing potential exit points for trades. This makes it especially popular among forex traders who need a clear and easy-to-understand visual tool. Due to its simplicity and effectiveness in trending markets, the Parabolic SAR is widely used in forex trading strategies, offering traders a straightforward approach to analyzing price trends and reversals.
How the Parabolic SAR indicator works
The Parabolic SAR indicator operates on a "stop-and-reverse" principle, meaning it helps traders identify both the direction of a trend and when that trend is likely to reverse. It achieves this by plotting dots either above or below the price action on a chart. When the dots appear below the price, it suggests a bullish trend; when they appear above, it indicates a bearish trend. As prices rise or fall, the dots move closer to the price, eventually signaling a potential reversal when the price crosses the dots.
The core formula behind the Parabolic SAR involves two key components: the acceleration factor (AF) and the extreme point (EP). The AF starts at a default value of 0.02 and increases incrementally each time a new high or low (EP) is reached, up to a maximum value, typically set at 0.20. The acceleration factor makes the Parabolic SAR more sensitive to price changes, enabling the indicator to adjust its position closer to the price as the trend strengthens.
Due to this dynamic nature, the Parabolic SAR is highly responsive to trends, making it a useful tool for identifying potential trend reversals early. However, its effectiveness is particularly prominent in strongly trending markets, where clear trends can be followed and acted upon.
Advantages of using the Parabolic SAR indicator
The Parabolic SAR indicator offers several advantages to forex traders, particularly due to its simplicity and clarity in signaling trend direction. One of its primary benefits is the visual ease with which traders can identify trends. When the dots appear below the price, it signals an upward trend, and when they appear above, it indicates a downward trend. This clear distinction helps traders quickly assess the market’s current direction without needing complex analysis.
Another advantage is its utility in risk management. The Parabolic SAR is often used to set stop-loss levels. As the dots move closer to the price, they provide a trailing stop-loss guide, helping traders lock in profits while minimizing potential losses. This makes the Parabolic SAR particularly helpful for managing risk in volatile market conditions.
The indicator's versatility is best demonstrated in trending markets, where it performs exceptionally well by following established trends. While it may struggle in sideways or ranging markets, its strength lies in its ability to track price movements when the market has clear directional momentum.
Additionally, the Parabolic SAR works well when combined with other technical indicators like moving averages or the Relative Strength Index (RSI).

Challenges of the Parabolic SAR
While the Parabolic SAR indicator is effective in trending markets, it has notable limitations when the market is sideways or ranging. In such conditions, where prices fluctuate within a narrow range without clear directional movement, the indicator tends to generate false signals. The dots may frequently shift from above to below the price, leading to confusion and potential losses for traders who rely solely on the Parabolic SAR for trade entries and exits. This underperformance in ranging markets is one of its key weaknesses.
Another challenge is the risk of false signals in highly volatile conditions. When prices are highly erratic, the Parabolic SAR can be too reactive, signaling trend reversals prematurely or too frequently. This can result in traders entering or exiting trades at inopportune times, which increases the risk of losses.
To address these issues, it is crucial to combine the Parabolic SAR with other technical indicators. For instance, pairing it with a moving average can help smooth out market noise and confirm trend direction, while using it alongside the Relative Strength Index (RSI) can filter out false signals by indicating overbought or oversold conditions.
How to use the Parabolic SAR in forex trading
To effectively use the Parabolic SAR indicator in forex trading, traders can follow a systematic approach to incorporate it into their strategies. The first step is to identify the trend direction. This is done by observing the SAR dots in relation to the price. When the dots are below the price, it signals an upward or bullish trend. Conversely, dots above the price indicate a downward or bearish trend.
Once the trend is identified, traders can plan their trade entries and exits. In a bullish trend, traders might choose to enter a long (buy) position as long as the dots remain below the price. When the dots shift above the price, signaling a potential trend reversal, it can be a signal to exit the trade or enter a short (sell) position. The Parabolic SAR is also useful for setting stop-loss levels. Traders can adjust their stop-losses to the position of the SAR dots, ensuring they trail the price as the trend progresses, thus managing risk effectively.
To enhance the accuracy of signals, it’s common to combine the Parabolic SAR with other indicators. For example, using the SAR alongside the Moving Average Convergence Divergence (MACD) or the Relative Strength Index (RSI) can help confirm trend strength and filter out false signals, leading to more precise trade execution.

Common Parabolic SAR strategies for forex traders
The Parabolic SAR indicator offers multiple strategies for traders to capitalize on market trends. Below are four commonly used approaches in forex trading:
Trend continuation strategy
In this strategy, traders use the Parabolic SAR to follow strong trends. When the SAR dots are consistently below the price, it signals a bullish trend, prompting traders to hold or enter a buy position. Conversely, when the dots remain above the price, it indicates a bearish trend, signaling a hold or entry in a sell position. This method allows traders to ride the trend until the indicator signals a potential reversal.
Reversal trading strategy
Traders can also use the Parabolic SAR to identify trend reversals early. When the dots flip from below to above the price (or vice versa), it suggests the current trend may be weakening and a reversal is imminent. Traders can capitalize on this signal by entering the market early, potentially benefiting from the new trend direction.
Parabolic SAR with moving averages
Combining the Parabolic SAR with moving averages helps filter out market noise. Moving averages smooth out price action and provide additional confirmation of the trend, reducing the chances of acting on false signals. This combination is particularly useful in highly volatile markets.
Risk management strategy
The Parabolic SAR is also useful for trailing stop-losses. As the trend progresses, traders can adjust their stop-loss orders to follow the SAR dots, protecting profits while managing risk. This trailing stop-loss strategy ensures the position remains open as long as the trend continues.
Examples of the Parabolic SAR in forex
The Parabolic SAR indicator is frequently used by professional forex traders as part of their overall trading systems. One notable example involves traders utilizing the indicator on major currency pairs such as EUR/USD or GBP/JPY. For instance, in a trending market like the EUR/USD pair, traders may observe the SAR dots consistently below the price, signaling an ongoing bullish trend. This helps them maintain their buy positions longer, allowing them to ride the trend until the dots flip, indicating a potential reversal.
In real-time, many traders also combine the Parabolic SAR with other indicators, such as the Moving Average or the Relative Strength Index (RSI), to increase accuracy. For example, during periods of high volatility in pairs like GBP/JPY, the Parabolic SAR can give early trend signals, but these may need to be confirmed by other tools to avoid false signals in choppy conditions.
While there are success stories, such as traders profiting from strong trending periods by using the Parabolic SAR to time their entries and exits effectively, there are also instances of failure. In ranging or volatile markets, the indicator can produce frequent false signals. Traders relying solely on the Parabolic SAR without confirming the trend through other indicators may experience losses due to sudden price reversals or market indecision, highlighting the importance of applying the indicator thoughtfully in different market environments.
Conclusion
The Parabolic SAR indicator offers several advantages for forex traders, particularly for those seeking clear and simple signals to identify trends and potential reversals. Its visual clarity, with dots appearing above or below price action, makes it an accessible tool for traders of all levels. The Parabolic SAR also assists in managing risk by providing an effective method for setting trailing stop-losses, allowing traders to protect profits as the trend progresses.
For traders focused on trend-following strategies, the Parabolic SAR is especially valuable in trending markets, where it can help them stay in positions longer and exit at the right moment when the trend shows signs of reversal. While the indicator performs best in strong directional markets, it can be enhanced by combining it with other tools like moving averages or the RSI to avoid false signals in sideways or volatile conditions.


