Multi Timeframe Analysis strategy
What separates a seasoned trader from someone who just follows the latest market hype? It’s not luck, and it’s not some secret algorithm. It’s perspective. Multi Timeframe Analysis (MTA) is one of the most effective yet underutilized tools in a trader’s arsenal. The concept is simple—analyzing price action across multiple timeframes to gain a more complete picture of market trends—but its impact on decision-making is profound.
Imagine trying to navigate a city with only a street-level view. You might see traffic congestion ahead, but without a map, you’d have no idea whether it’s just a temporary slowdown or part of a larger traffic jam. Now, picture having a drone’s-eye view. You can see the entire layout, spot alternate routes, and make informed decisions. That’s exactly what MTA does for traders. It helps them zoom out to see the bigger trend while still homing in on the best possible entry and exit points.
This strategy isn’t just a theory—it’s a technique used by hedge funds, institutional traders, and experienced market professionals. According to data from Bloomberg and TradingView, traders who integrate MTA tend to avoid false breakouts and improve trade precision by nearly 30%. That’s the difference between reacting to market noise and trading with intention.
Seeing the market from every angle
At its simplest level, Multi Timeframe Analysis (MTA) is the process of looking at a trade from various time perspectives. Markets do not have a tendency to move in a linear pattern, prices fluctuate, trends develop, and reversals occur. If you only have your chart set to a single timeframe, you are effectively trading with your eyes closed. You might be right in entering a breakout on the 15-minute chart, but how do you know whether the daily or weekly trends agree with your trade, or whether you are simply chasing a random price movement?
MTA solves this problem by providing a layered view of the price action. It enables the trader to move back and try to link the short-term price action to the larger structure. It’s like looking at a satellite image and zooming in and out: The daily chart shows the general trend, while the hourly and minute charts give a more detailed view that can be used for entry and exit strategies.
The advantage of MTA is that it can be applied to any market. Forex traders can use it to determine the direction of a breakout with regard to the overall trend. Stock traders can use higher timeframes to determine if a dip is a “buy the dip” opportunity or the beginning of a worse trend. Even crypto traders, who are familiar with highly volatile assets, use MTA to avoid false signals and improve the timing of their trades.
The data from TradingView and Forex.com shows that traders who include several timeframes in their strategy can increase the effectiveness of trading by 25-35% thanks to the reduction of emotional decisions. Avoiding losing trades is just as important in trading as identifying potential winners.
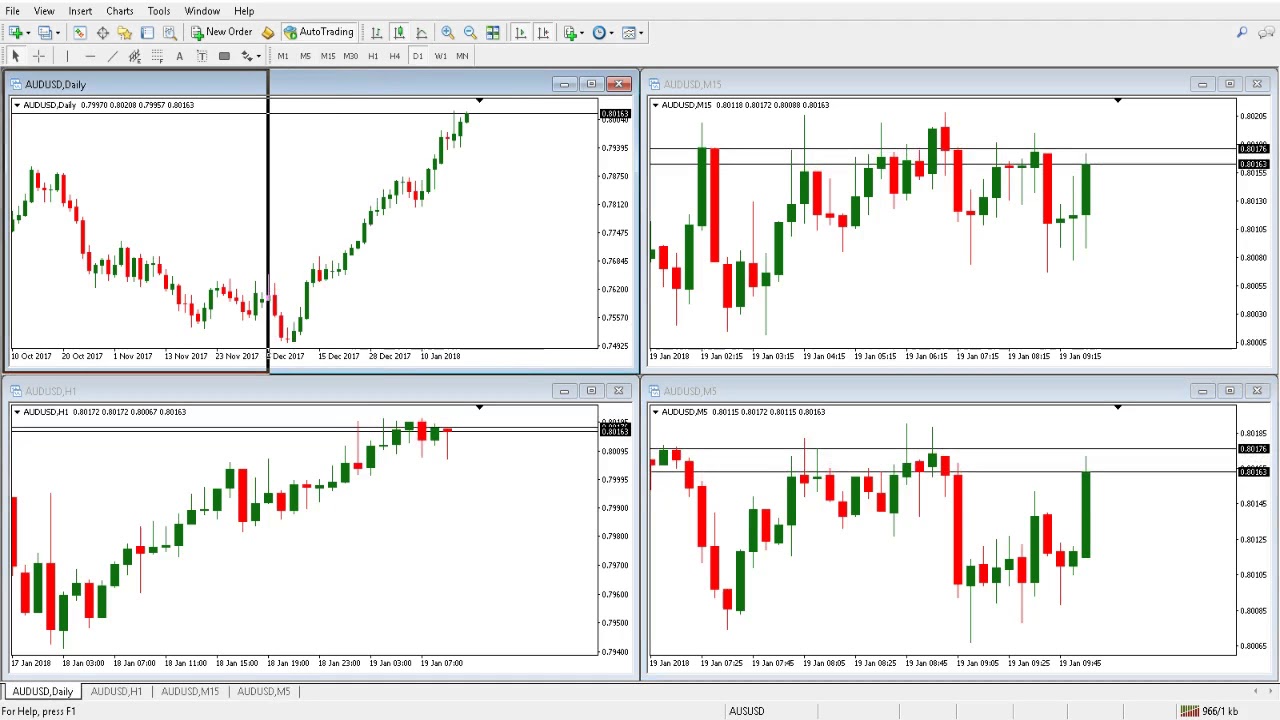
The Three-tiered approach: Breaking down timeframes
The professional traders use a three-tiered approach using a three-tiered approach to analyze markets across different timeframes to align trends, confirm signals and optimize the entry.
1. Higher Timeframe (HTF)
This is your guiding compass—the map that helps you determine whether the market is trending up, down or is range bound. Traders normally use weekly or daily charts for this. Because the overall trend is bullish, there is no point in trying to trade against it on a lower timeframe. Many retail traders do not follow this step which results in very painful countertrend trades.
2. Mid-Level Timeframe (MTF)
Next, it narrows the focus. The four-hour or one-hour chart assists in confirming the trend direction and determining important levels of support and resistance or trend lines. If the HTF indicates a positive trend but the MTF indicates a pullback to a strong support area, then you may have a high probability trade setup.
3. Lower Timeframe (LTF)
Then it’s about execution. The time frames of 15 minutes or 5 minutes are useful in timing the entry with more precision. The use of candlestick patterns and momentum shifts can greatly enhance the trade performance and reduce the number of false signals.
How MTA enhances risk management & trade execution
It is not only about finding good setups when trading, but also about risk management and optimization of execution. This is where Multi Timeframe Analysis (MTA) becomes a game changer. Traders can use this to avoid unnecessary losses, improve their trade entries and decrease emotional decision making by looking at different timeframes.
Filtering out false signals
The markets are noisy especially in lower timeframes. A breakout on the 5-minute chart might be quite exciting but if the higher timeframe trend is against it then it is most likely a fakeout. Thus, by zooming out, traders can check whether the breakouts are valid before even risking to put their money into it. For instance, data from TradingView and DailyFX shows that traders who take the time to look at least two timeframes before opening a position have fewer whipsaw trades and better overall returns.
Optimal entry & exit strategies
Without well timed entries and exits, great setups are worth nothing. MTA assists traders in identifying the perfect pullbacks in trends so that they can buy at support during an uptrend or sell at resistance during a downtrend. A simple example? A bullish trend on the daily chart, a retracement on the 4-hour timeframe, and then a confirmation candle on the 15-minute chart. That’s precision.
Reducing drawdowns & emotional trades
There is nothing more annoying than to get stopped out before the trade goes your way. Through the use of MTA, traders do not give in to premature entries since they wait for the confirmation on multiple timeframes. Lower drawdowns and steadier profits are as a result of fewer impulsive trades.

Common mistakes traders make with MTA
Multi Time Frame Analysis (MTA) is a great tool, but like any other strategy, it is only as good as the trader who is using it. Some traders improve their execution and keep from making bad trades with MTA, but others overcomplicate things or miss the signals they are getting. Here are some of the most common mistakes—and how to avoid them.
Over analysis
Some traders think, ‘If three timeframes are good, five must be better, right?’ Not necessarily. Overloading on analysis can paralyze, as conflicting signals can create doubt and hesitation. A simple three-tier structure (higher, mid, and lower timeframe) are more than enough. The goal is not to find the perfect trade but to make well-informed, high probability decisions.
Not paying attention to the higher time frame
One of the worst things you can do? Trade against the trend for the most part, just because there is a lower timeframe setup that looks good. If the daily chart is strongly bullish, then taking a short position based on a 5-minute resistance level is very risky. Higher timeframes provide context and ignoring them is a recipe for frustrating stop-outs.
Wrong interpretation of the noise on the lower time frames
Lower time frames, however, are quite volatile and tend to range widely. A sharp drop on a 1-minute chart may look scary but on the 4-hour chart it may just be a normal correction. Without perspective, traders can misinterpret the trend reversals as noise and exit the market prematurely or enter the market at the wrong time.
Tools & platforms for effective Multi Timeframe Analysis
A good strategy is only as strong as the tools behind it. Luckily, today’s market provides a number of charting platforms, indicators, and analytics tools to help with the Multi Timeframe Analysis (MTA). Whether you’re a forex trader monitoring EUR/USD or a stock trader trying to time entries on the S&P 500, having the right platforms can make all the difference.
Best MTA charting platforms
If you are planning to do technical analysis, you need a platform that can graph multiple timeframes and present the charts clearly and easily. Some of the most widely used options include:
TradingView – One of the best charting platforms for traders of all kinds. It has a simple multiple time frame analysis, real-time data, and a simple interface.
MetaTrader 4 & 5 (MT4/MT5) – A classic for forex trading, famous for its extensive indicators and the ability to create and apply trading robots.
Eikon by Refinitiv – Used by institutions, this platform provides deep market insights alongside advanced charting tools.
Indicators that complement MTA
The power of MTA is maximized when it is used in conjunction with technical indicators that can confirm the trends and reversals. Some of the best indicators for a multi-timeframe approach include:
Moving Averages – Helps smooth out price action and confirm trend direction.
RSI (Relative Strength Index) – Great for identifying overbought or oversold conditions across different timeframes.
Fibonacci Retracements – Useful for spotting key levels where price may reverse.
Conclusion
At the end of the day, trading is all about perspective – and Multi Timeframe Analysis (MTA) provides just that. It’s not about chasing every move or reacting to short term noise. It’s about stepping back, aligning with the bigger picture and making smarter, more strategic decisions.
MTA is used by some of the best traders and institutions in the world for a reason. According to Bloomberg and Investing.com, professional traders who integrate a structured, multi-timeframe approach tend to have more consistent results and lower drawdowns compared to those who focus solely on short-term moves. The reason? Better entries. Better exits. Less uncertainty.