Moving average pullback strategy
This strategy leverages one of the most fundamental indicators in technical analysis—the moving average—to identify potential entry points during temporary price retracements within an established trend. Rather than chasing the price at its peak or reacting impulsively to market fluctuations, traders using this method patiently wait for pullbacks, allowing them to enter trades at more favourable levels.
The appeal of the moving average pullback strategy lies in its simplicity and adaptability. It can be applied across various timeframes and currency pairs, making it suitable for day traders, swing traders, and even long-term investors. Moreover, when combined with complementary indicators like the Relative Strength Index (RSI) or Moving Average Convergence Divergence (MACD), this strategy can enhance trade accuracy while managing risk effectively.
Understanding moving averages in forex trading
Moving averages are fundamental tools in technical analysis, widely used by forex traders to identify trends and smooth out price fluctuations over a specific period. At their core, moving averages help traders filter out the "noise" of short-term market volatility, providing a clearer view of the underlying price direction.
There are two primary types of moving averages commonly used in forex trading:
Simple Moving Average (SMA)
This is the most basic form, calculated by adding the closing prices of a currency pair over a set number of periods and dividing the sum by that number. For example, a 20-day SMA averages the closing prices of the past 20 days. The SMA provides a steady, smoothed line that helps identify longer-term trends but may lag behind rapid price movements.
Exponential Moving Average (EMA)
Unlike the SMA, the EMA gives more weight to recent price data, making it more responsive to current market conditions. This feature is particularly useful in fast-moving forex markets, where traders need to react quickly to trend changes.
Forex traders often use key moving average periods such as 20, 50, 100, and 200. Shorter periods (e.g., 20 EMA) are ideal for identifying short-term trends, while longer periods (e.g., 200 SMA) help spot long-term market directions.
What is the moving average pullback strategy?
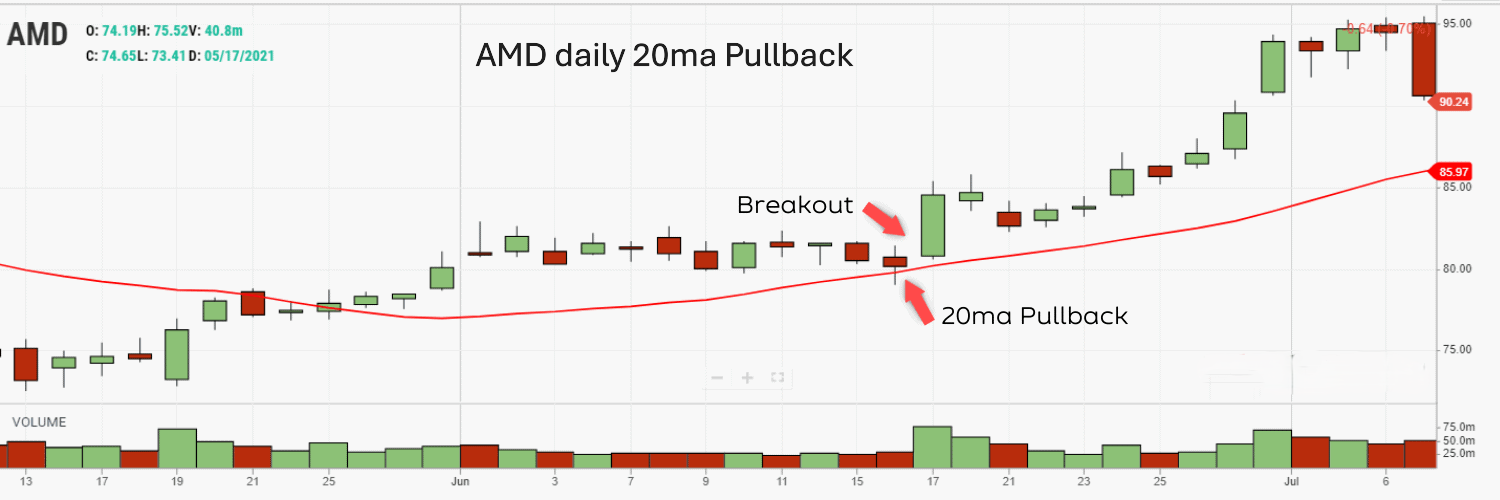
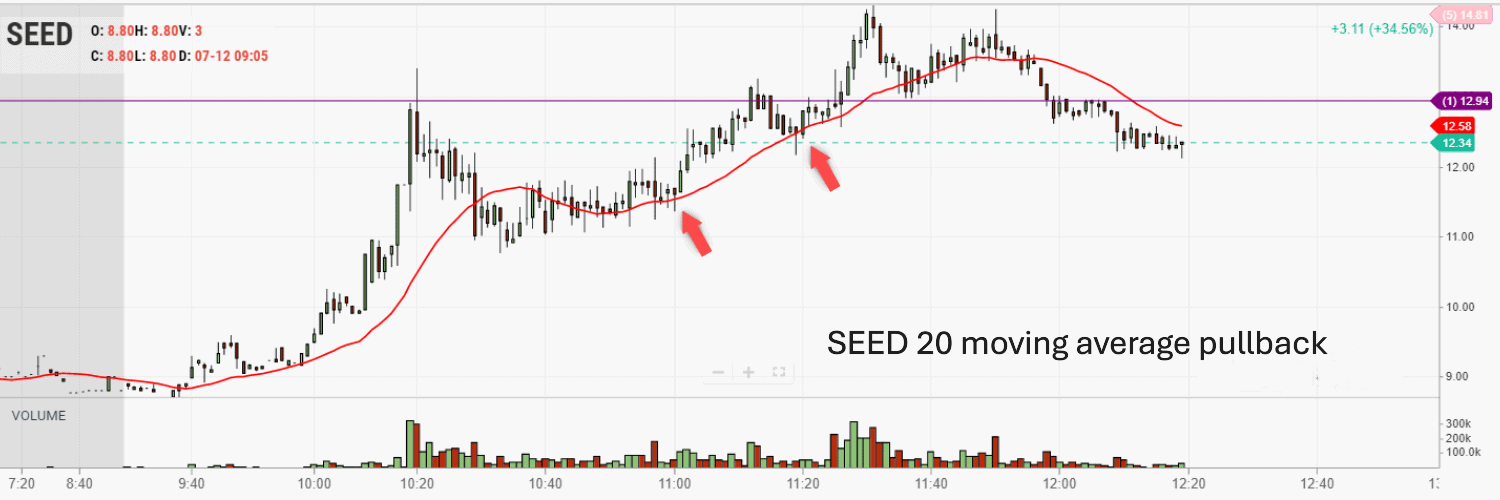
The moving average pullback strategy is a trend-following approach that helps traders capitalize on price retracements within an established trend. Rather than entering trades at the peak of price movements, this strategy focuses on identifying temporary pullbacks—short-term reversals or pauses—before the price resumes its primary trend. This method allows traders to enter positions at more favorable prices with potentially lower risk.
A pullback occurs when the price temporarily moves against the prevailing trend. In an uptrend, this means a brief decline, while in a downtrend, it’s a short-lived rally. The moving average acts as a dynamic support or resistance level, depending on the trend direction. When the price pulls back to the moving average, it often finds support (in an uptrend) or resistance (in a downtrend) before continuing in the original direction.
- Identify the trend: Use moving averages like the 20 EMA or 50 SMA to confirm if the market is trending upward or downward.
- Wait for a pullback: Look for the price to retrace toward the moving average without breaking the trend structure.
- Enter the trade: Once the price shows signs of resuming the trend (e.g., bullish candlestick patterns in an uptrend), consider entering a position.
Setting up the moving average pullback strategy
Implementing the moving average pullback strategy effectively requires selecting the right moving averages, timeframes, and complementary technical indicators to enhance trade accuracy. The setup can be customized based on a trader’s style—whether day trading, swing trading, or position trading.
Choosing the right moving average:
- Short-term traders (Day trading): Prefer faster-moving averages like the 9 EMA or 20 EMA, which respond quickly to price changes.
- Swing traders: Often rely on the 50 SMA or 100 EMA to capture medium-term trends.
- Long-term traders: Use slower averages such as the 200 SMA to identify broad market directions.
Selecting the timeframe:
While the strategy works across multiple timeframes, common choices include the 1-hour, 4-hour, and daily charts. Shorter timeframes provide more frequent signals but may include more noise, whereas higher timeframes offer stronger trend confirmation.
Complementary Indicators:
- Relative Strength Index (RSI): Helps identify overbought or oversold conditions during pullbacks.
- Moving Average Convergence Divergence (MACD): Confirms trend strength and momentum.
- Fibonacci Retracement Levels: Highlight potential pullback areas where price might react.
Setting up on trading platforms:
On platforms like MetaTrader 4/5 or TradingView, traders can easily apply moving averages by adding indicators from the chart settings. Adjust the period and type (SMA or EMA) based on preference. Combining these tools with price action analysis improves the reliability of trade setups, providing a comprehensive framework for informed decision-making.
Entry and exit rules for the moving average pullback strategy
Establishing clear entry and exit rules is crucial for successfully applying the Moving Average Pullback Strategy. These rules help traders identify high-probability trade setups while managing risk effectively.
Entry criteria:
- Ensure the market is in a clear uptrend or downtrend, indicated by the price consistently trading above (uptrend) or below (downtrend) a key moving average like the 20 EMA or 50 SMA.
- Look for the price to retrace toward the moving average without breaking the overall trend structure. This pullback often appears as a series of small candles moving against the trend.
- Before entering, watch for bullish reversal patterns (e.g., hammer or bullish engulfing) in an uptrend or bearish patterns (e.g., shooting star or bearish engulfing) in a downtrend. Adding indicators like the RSI (to confirm oversold/overbought conditions) or the MACD (for trend momentum) can strengthen the signal.
Exit strategies:
- Set a stop-loss slightly below the recent pullback low in an uptrend or above the recent high in a downtrend. This limits potential losses if the trend reverses.
- Target previous support/resistance zones, Fibonacci extension levels, or use a trailing stop-loss to lock in profits as the price moves in your favour.
- Aim for a minimum 1:2 risk-reward ratio, ensuring potential profits outweigh the risks.
Risk management in moving average pullback trading
Effective risk management is essential for the long-term success of any trading strategy, including the Moving Average Pullback Strategy. While identifying optimal entry and exit points is crucial, managing potential losses is what ultimately preserves capital and ensures trading longevity.
Position sizing and risk-reward ratio:
Determining the appropriate position size based on account equity and risk tolerance is fundamental. Many traders follow the 1-2% rule, meaning they risk no more than 1-2% of their trading capital on a single trade. Additionally, maintaining a favorable risk-reward ratio—preferably 1:2 or higher—ensures that potential profits outweigh losses over time.
Stop-loss and trade management:
A stop-loss order is a non-negotiable component of this strategy. Place stop-loss levels just beyond recent pullback lows (in an uptrend) or highs (in a downtrend) to limit losses if the price moves against your position. Trailing stop-losses can also be employed to protect profits as the trend continues, automatically adjusting with price movements.
Managing trades during high-impact news events:
Economic announcements, such as Non-Farm Payrolls (NFP), Federal Reserve rate decisions, or ECB policy updates, can cause sharp volatility that may trigger stop-losses prematurely. Traders should either avoid entering new positions around these events or adjust their strategies to account for heightened risk.
Common mistakes to avoid with the moving average pullback strategy
Misinterpreting false pullbacks vs. trend reversals:
One of the most frequent errors is confusing a genuine pullback with the early stages of a trend reversal. A pullback is a temporary retracement within a trend, while a reversal signals a complete change in direction. To avoid this, traders should confirm the trend’s strength using additional indicators like the MACD or RSI, and look for higher highs and higher lows (in uptrends) or lower highs and lower lows (in downtrends) to validate the trend’s continuation.
Over-reliance on a single timeframe:
Focusing solely on one timeframe can lead to missed signals or false confirmations. This strategy works best when combined with multi-timeframe analysis. For example, traders might confirm the overall trend on a 4-hour chart and then identify precise entry points on a 1-hour chart. This approach provides better context and reduces the risk of trading against the broader market trend.
Ignoring the broader market context:
Relying exclusively on technical indicators without considering macroeconomic factors can lead to poor decisions. Major economic events, central bank announcements, and geopolitical developments can cause price movements that defy technical patterns. Staying informed through reputable sources like Reuters, Bloomberg, or DailyFX helps traders anticipate potential market shifts.
Conclusion
The Moving Average Pullback Strategy remains a reliable tool for forex traders seeking to capitalize on trends with well-timed entries. By focusing on price retracements within an established trend, this strategy helps traders avoid the common danger of chasing prices at unsustainable levels. Instead, it encourages patience, discipline, and data-driven decision-making—key qualities for long-term trading success.
While the strategy shines in trending markets, traders must remain cautious during periods of low volatility or range-bound price action, where false signals can occur. Integrating additional technical tools like the RSI, MACD, and Fibonacci retracement levels can enhance accuracy, offering a more comprehensive view of market conditions.