MACD histogram strategy
The Moving Average Convergence Divergence (MACD) histogram is one of the most widely used tools in technical analysis, offering traders a reliable way to measure momentum and detect trend reversals. As a visual representation of the difference between the MACD line and the signal line, the histogram provides crucial insights into market dynamics.
Unlike many indicators that lag price action, the MACD histogram is designed to provide early signals by illustrating the strength and direction of price momentum. Its bar patterns can help traders anticipate changes in trends, making it a valuable component of both short-term and long-term trading strategies. However, the effectiveness of the MACD histogram largely depends on the trader’s ability to interpret its signals accurately and apply optimal settings.
Selecting the correct MACD histogram settings is critical, as these parameters influence the behavior of the indicator and its responsiveness to price changes. Whether you are a scalper looking for quick entries or a swing trader aiming to capture larger market moves, tailoring these settings to align with your trading style is essential.
Understanding the MACD histogram
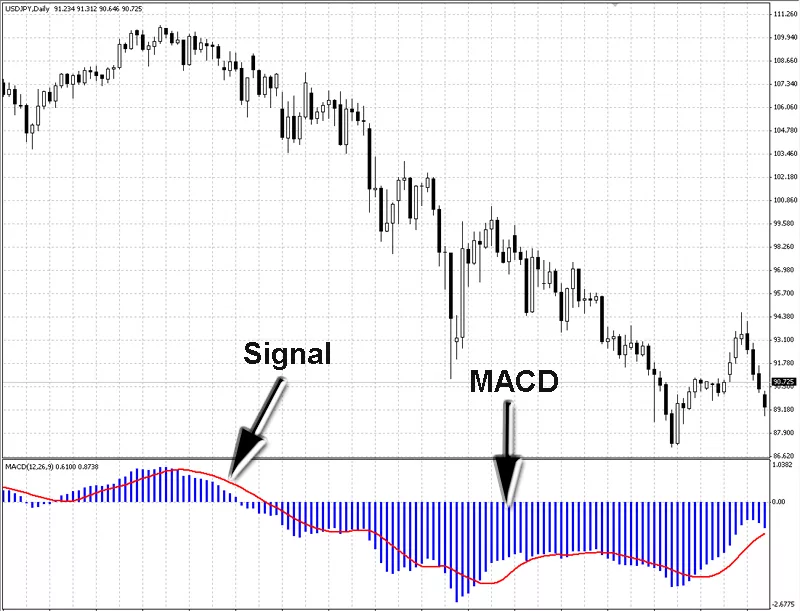
The MACD histogram is a critical component of the Moving Average Convergence Divergence (MACD) indicator, a widely used tool in technical analysis. Designed to measure the difference between the MACD line and the signal line, the histogram visually represents momentum shifts within the market. For traders, understanding how to interpret the histogram’s movements is essential for identifying opportunities and managing risks effectively.
The MACD histogram consists of bars that oscillate above and below a zero line. These bars grow longer as the distance between the MACD line and the signal line widens, indicating stronger momentum. Conversely, the bars shrink as the lines converge, signaling a potential loss of momentum. Positive histogram values suggest bullish momentum, while negative values point to bearish conditions.
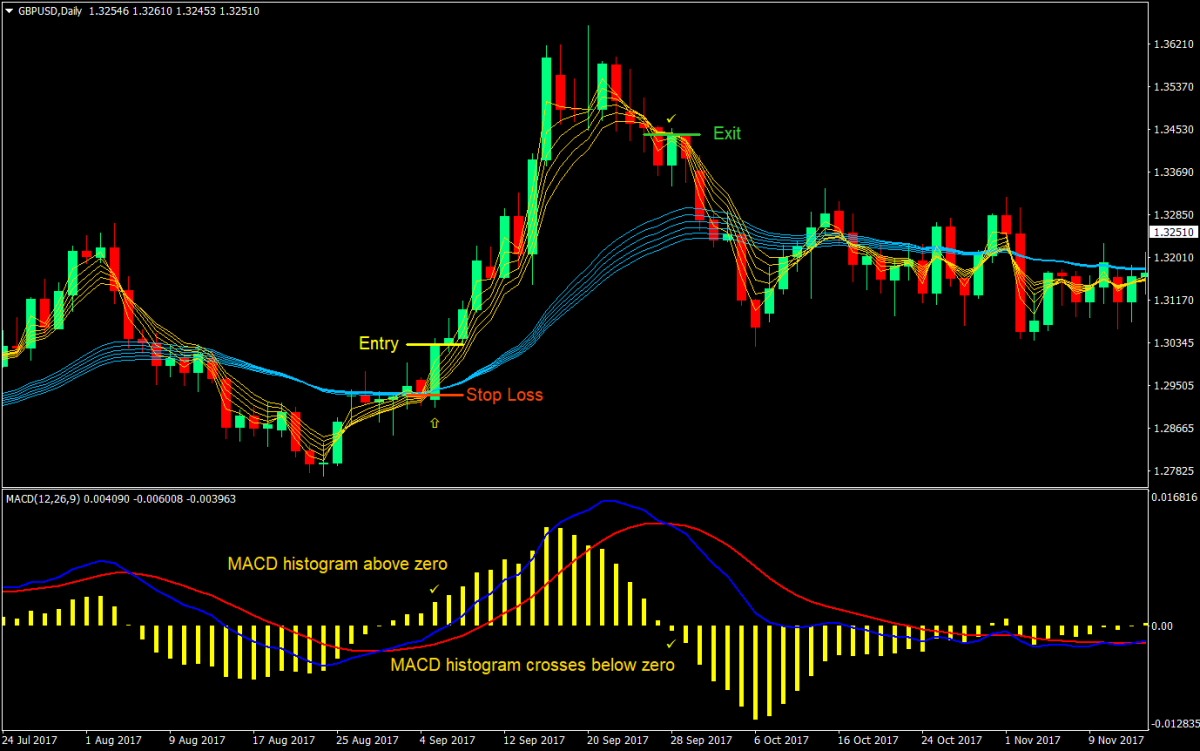
The histogram’s behavior is particularly useful for identifying key moments in the market, such as trend reversals or continuations. For example, when the bars cross the zero line from negative to positive, it often signals a bullish shift, while a move from positive to negative suggests bearish momentum. These shifts can serve as valuable entry or exit points for traders.
While the MACD histogram is a powerful indicator, it is important to use it in conjunction with other analysis tools. Its simplicity can sometimes lead to false signals, particularly in choppy or low-volatility markets. By combining the histogram with other indicators, such as moving averages or RSI, traders can gain a more comprehensive view of market conditions and improve the accuracy of their decisions.
Optimizing MACD histogram settings
The effectiveness of the MACD histogram largely depends on its settings, which determine how sensitive the indicator is to price movements. By understanding and adjusting these parameters, traders can tailor the MACD histogram to align with their trading style and market conditions, improving the reliability of the signals it generates.
The default settings for the MACD histogram are (12, 26, 9). These values represent the fast exponential moving average (EMA), the slow EMA, and the signal line's smoothing period, respectively. For many traders, these default settings provide a balanced view of market momentum, making them suitable for most currency pairs and timeframes. However, in certain trading environments, adjustments may be necessary.
For scalpers operating on lower timeframes, shorter EMA settings, such as (8, 21, 5), can make the MACD histogram more responsive to rapid price changes. On the other hand, swing traders focused on higher timeframes may benefit from longer settings like (15, 30, 9), which smooth out noise and emphasize significant trends.
Customization of settings should be guided by backtesting and alignment with trading objectives. Traders should test various configurations on historical data to determine which provides the most accurate signals for their chosen currency pairs and timeframes.

MACD histogram trading strategies
The MACD histogram is a versatile tool that can be applied to various trading strategies, helping forex traders identify entry and exit points with precision. By focusing on its unique ability to track momentum and trend changes, traders can develop robust approaches for different market conditions.
Divergence strategy
One of the most popular strategies involves spotting divergences between price action and the MACD histogram. A bullish divergence occurs when the price forms lower lows while the histogram forms higher lows, signaling a potential upward reversal. Conversely, a bearish divergence, where the price forms higher highs and the histogram forms lower highs, suggests a possible downtrend. These divergences often precede significant trend changes, offering traders early insights.
Zero-Line crossover strategy
The MACD histogram’s zero-line crossovers provide clear signals for trend shifts. When the histogram moves from negative to positive territory, it indicates growing bullish momentum, suggesting a potential buying opportunity. A crossover from positive to negative reflects bearish momentum and may signal a sell.
Combining with other indicators
Enhancing the MACD histogram’s accuracy involves pairing it with complementary tools. For instance, using it alongside Relative Strength Index (RSI) can confirm overbought or oversold conditions. Similarly, incorporating moving averages helps validate trend strength.
Adjusting for market conditions
The MACD histogram performs best in trending markets but can produce false signals in sideways markets. Traders should identify the market environment and adapt their strategies accordingly to maximize success.
Practical tips for using the MACD histogram strategy
To maximize the effectiveness of the MACD histogram strategy in forex trading, traders must focus on practical considerations that enhance precision and consistency. Proper application, combined with disciplined risk management, can significantly improve trading outcomes.
Choosing the Right Timeframe
The MACD histogram's performance varies across timeframes. Scalpers often rely on shorter timeframes, such as 1-minute or 5-minute charts, where the histogram captures rapid momentum shifts. Conversely, swing traders may prefer daily or 4-hour charts to identify broader trends. Aligning the timeframe with your trading style ensures the indicator delivers relevant signals.
Aligning with Market Conditions
The MACD histogram works best in trending markets, where its signals are clearer and more reliable. Before applying it, assess whether the market is trending or ranging. In choppy conditions, complement the MACD histogram with additional tools like Bollinger Bands or support and resistance levels to filter out noise.
Implementing Risk Management
Effective risk management is key to successful trading. Combine MACD histogram signals with appropriate stop-loss and take-profit levels to protect your capital. For instance, place a stop-loss below recent support in bullish trades or above resistance in bearish setups. Position sizing based on risk tolerance further safeguards against excessive losses.
Backtesting and Journaling
Testing the MACD histogram strategy on historical data is essential for gauging its effectiveness. Additionally, maintaining a trading journal allows you to evaluate the outcomes of your trades and refine your approach over time.

Advantages and Limitations of the MACD Histogram Strategy
The MACD histogram strategy is widely respected among forex traders for its ability to deliver actionable insights, but it is essential to understand both its strengths and limitations to use it effectively.
Advantages
One of the key benefits of the MACD histogram is its simplicity. The visual representation of momentum changes through histogram bars makes it accessible for traders of all experience levels. By highlighting shifts in momentum and providing zero-line crossover signals, the histogram helps traders identify potential trend reversals or continuations with ease.
Another advantage is its versatility. The MACD histogram is applicable across various timeframes and currency pairs, making it a flexible tool for scalpers, day traders, and swing traders alike. Its adaptability also extends to different market conditions, performing well in both trending and transitional phases when used alongside other indicators.
Additionally, the MACD histogram’s ability to measure momentum rather than just price levels makes it an excellent tool for confirming trends, reducing the likelihood of entering trades based on weak signals.
Limitations
Despite its utility, the MACD histogram is a lagging indicator, meaning its signals are based on past price action. This can sometimes result in delayed entries or exits, especially in fast-moving markets.
False signals are another potential drawback, particularly in low-volatility or ranging markets where the histogram may generate misleading crossovers or divergences. To mitigate this, traders should avoid relying solely on the MACD histogram and instead combine it with other indicators or tools for confirmation.
Conclusion
The MACD histogram is a powerful and versatile tool for forex traders, providing insights into market momentum and potential trend shifts. Its visual representation of the relationship between the MACD line and the signal line helps traders identify key entry and exit points, making it a valuable addition to any trading strategy.
The success of the MACD histogram strategy lies in understanding how to interpret its signals effectively. By recognizing divergences, zero-line crossovers, and shifts in momentum, traders can anticipate market movements with greater confidence. However, the indicator’s performance is heavily influenced by the chosen settings, making it essential to tailor the MACD parameters to match individual trading styles and market conditions.
While the MACD histogram is most effective in trending markets, combining it with complementary indicators such as the Relative Strength Index (RSI) or moving averages can improve its accuracy in ranging or choppy conditions. Moreover, proper risk management practices, such as setting stop-losses and managing position sizes, are critical to mitigating potential losses.
It’s important to remember that no single indicator guarantees success. Traders should use the MACD histogram as part of a broader strategy that includes thorough market analysis, and backtesting. Maintaining a trading journal to track performance and refine strategies over time is equally vital.


