Know all about spinning top candlestick pattern
Understanding candlestick patterns is vital for forex traders as they help in predicting future price movements and making informed trading decisions. By interpreting these patterns, traders can identify potential trend reversals, continuations, and indecisions in the market. This knowledge enhances the trader's ability to enter and exit trades at optimal times, thereby improving their chances of profitability.
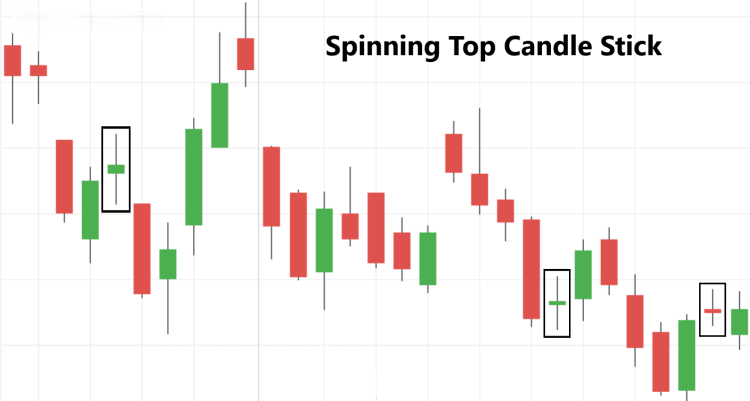
One such candlestick pattern is the spinning top. Characterized by a small body and long upper and lower shadows, the spinning top signifies market indecision. The small body indicates that the opening and closing prices were close, while the long shadows suggest significant volatility and a struggle between buyers and sellers. Recognizing the spinning top pattern can alert traders to potential changes in market direction, making it an essential component of a well-rounded trading strategy.
What is a spinning top candlestick pattern?
A spinning top candlestick pattern is a type of candlestick that indicates indecision in the market. It is characterized by a small real body, where the opening and closing prices are close to each other, and long upper and lower shadows. These shadows reflect significant price movement during the period, but the small body suggests that neither the buyers nor the sellers could gain control, leading to a close near the opening price.
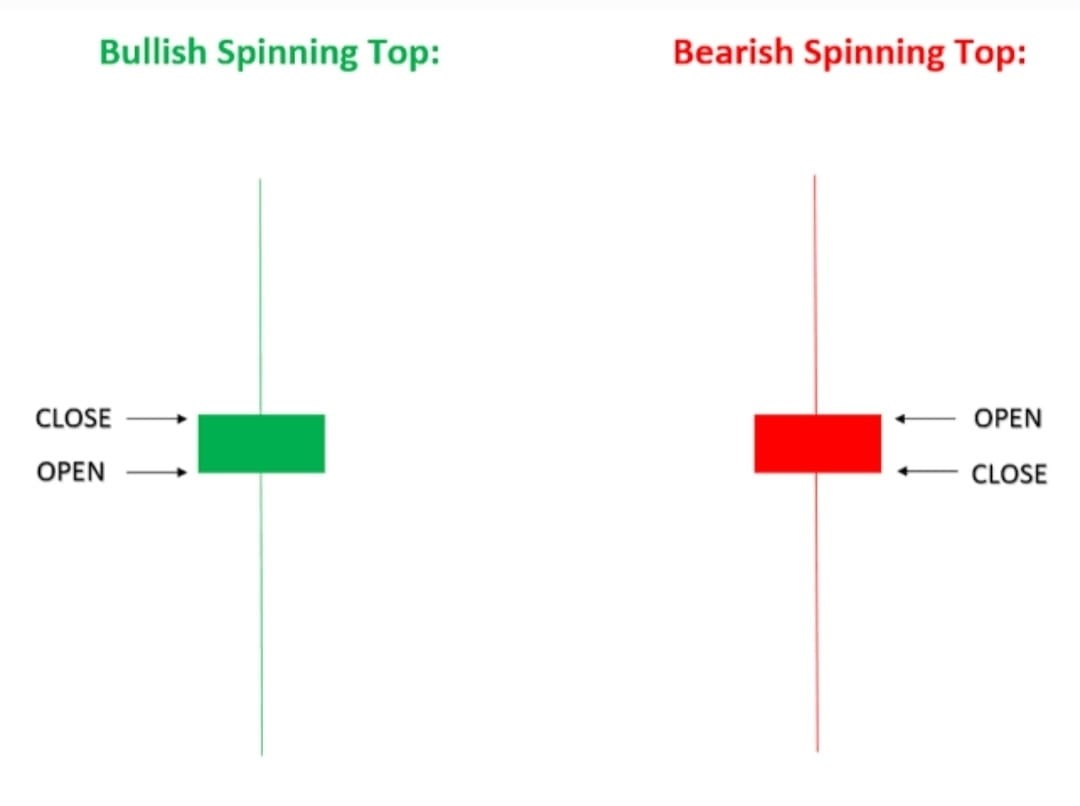
The visual representation of a spinning top candlestick shows a small central rectangle (the body) with extended lines above and below (the shadows or wicks). The body can be either bullish (white or green) or bearish (black or red), but its small size remains a key feature. The length of the shadows can vary, but they are usually longer than the body, highlighting the market's volatility and uncertainty during the trading session.
Spinning top candlesticks differ from other patterns like the doji and hammer. A doji also represents indecision but has an even smaller body, often resembling a cross, where the open and close prices are nearly identical. On the other hand, a hammer has a small body with a long lower shadow and little to no upper shadow, indicating a potential bullish reversal after a downtrend. Understanding these distinctions is crucial for traders to interpret market signals accurately and make informed trading decisions.
Formation and interpretation
Spinning top candlesticks form when there is significant volatility in the market, but neither the buyers nor the sellers can gain a decisive advantage. During the trading session, prices move substantially up and down, creating long upper and lower shadows. However, by the close of the session, the opening and closing prices are close to each other, resulting in a small real body. This small body, flanked by long shadows, is the hallmark of the spinning top pattern.
A spinning top can be either bullish or bearish. A bullish spinning top has a small green or white body, indicating that the close was slightly higher than the open. Conversely, a bearish spinning top has a small red or black body, where the close was slightly lower than the open. Despite these differences, both types reflect a market stalemate, where neither buyers nor sellers dominate.
The significance of the spinning top pattern lies in its representation of market indecision. It often appears after a strong price move, suggesting that the prevailing trend may be losing momentum. Traders view spinning tops as potential signals for a trend reversal or continuation, depending on the context and confirmation from subsequent price action. Recognizing this pattern helps traders prepare for possible changes in market direction, enhancing their decision-making process and risk management strategies.
Trading strategies using spinning top candlesticks
Spinning top candlesticks are valuable tools for identifying potential trend reversals. When a spinning top appears after a strong uptrend or downtrend, it indicates market indecision and a possible shift in momentum. Traders can use this signal to anticipate a reversal, preparing to enter or exit trades accordingly. For instance, if a spinning top forms at the top of an uptrend, it may signal that the upward momentum is waning, suggesting a potential move downward.
Combining spinning top patterns with other technical indicators enhances their reliability. For example, using moving averages can help confirm a trend reversal. If a spinning top appears and is followed by a crossover of short-term and long-term moving averages, this provides stronger evidence of a trend change. Similarly, incorporating the Relative Strength Index (RSI) can be useful. If a spinning top forms and the RSI indicates overbought or oversold conditions, the likelihood of a reversal increases.
Consider a scenario where a spinning top forms at the end of a strong bullish run in the EUR/USD forex pair. By also observing a moving average crossover and an RSI reading above 70, a trader might decide to short the pair, anticipating a downward correction. Such trades, when carefully executed with confirmation from additional indicators, can lead to successful outcomes, demonstrating the practical application of spinning top candlestick patterns in forex trading.
Advantages and limitations of spinning top candlestick patterns
Spinning top candlestick patterns offer several benefits in trading decisions. They serve as early indicators of market indecision and potential trend reversals, providing traders with an opportunity to reassess their positions. The small body and long shadows of a spinning top reveal a balance between buyers and sellers, signaling that the prevailing trend may be losing momentum. This information helps traders anticipate changes and make more informed decisions about entering or exiting trades.
However, spinning tops also have limitations. One common pitfall is the potential for false signals. Since spinning tops reflect indecision, they do not always result in a trend reversal. To avoid acting on false signals, traders should seek confirmation from other technical indicators, such as moving averages, RSI, or support and resistance levels. Relying solely on spinning tops without additional validation can lead to premature or incorrect trading decisions.
In comparison to other candlestick patterns, spinning tops are less definitive. For instance, patterns like the hammer or engulfing patterns provide stronger and more direct indications of potential trend reversals. Hammers, with their small bodies and long lower shadows, clearly suggest a bullish reversal after a downtrend. Engulfing patterns, where a larger candle fully engulfs the previous one, offer a more conclusive signal of a trend change. Therefore, while spinning tops are useful for highlighting market indecision, traders should use them in conjunction with other patterns and indicators to enhance their reliability and effectiveness in trading strategies.
Case studies
Historical instances of spinning top patterns in major forex pairs provide valuable insights into their practical application. For example, in August 2020, the EUR/USD pair exhibited a spinning top candlestick following a significant uptrend. The market had been bullish due to positive economic data from the Eurozone, pushing the EUR/USD higher. However, the spinning top indicated indecision among traders, leading to a subsequent consolidation phase and a minor reversal.
Analyzing the market conditions that lead to the formation of spinning top candlesticks is crucial for understanding their significance. In the case of EUR/USD in August 2020, several factors contributed to the market indecision. The rapid appreciation of the euro had reached a resistance level, where traders were uncertain about further upward movement. Additionally, mixed economic signals from the US and Eurozone created an environment where buyers and sellers were evenly matched, resulting in the spinning top formation.
Lessons learned from past market behaviors emphasize the importance of context and confirmation. The EUR/USD example shows that spinning tops often appear at critical junctures, such as resistance or support levels, signaling potential changes in market direction. However, relying solely on spinning tops can be misleading. Traders should always seek confirmation from other technical indicators and market analysis to validate the signals provided by spinning top patterns. By doing so, they can enhance their decision-making process and reduce the risk of false signals, ultimately leading to more successful trading outcomes.
Conclusion
Incorporating spinning top candlestick patterns into trading strategies is essential for navigating the forex market effectively. These patterns serve as early indicators of market indecision, providing traders with valuable insights into potential shifts in market sentiment. Recognizing a spinning top candlestick allows traders to anticipate possible reversals or continuations in the prevailing trend, helping them to make more informed trading decisions.
Spinning top candlestick patterns are vital because they identify key points where buyers and sellers are in balance. This balance frequently precedes major market movements, making spinning tops crucial signals for traders. By incorporating spinning tops into their analysis, traders can better anticipate changes in market dynamics, improving their timing and decision-making. Furthermore, using these patterns alongside tools like moving averages, RSI, and support and resistance levels enhances the reliability of the signals and offers a more complete understanding of market conditions.
In summary, spinning top candlestick patterns are valuable components of a well-rounded trading strategy. They help traders identify critical points of market indecision, enabling better timing and risk management. By leveraging these patterns alongside other technical analysis tools, traders can improve their decision-making process and enhance their overall trading performance.Top of Form