Know all about Hammer candlestick patterns
In the world of forex trading, understanding candlestick patterns is crucial for making informed trading decisions. Candlestick patterns, which originated from Japanese rice merchants in the 18th century, are visual representations of price movements within a specified time frame. Each candlestick shows the opening, closing, high, and low prices, providing traders with valuable insights into market sentiment and potential price reversals.
The importance of understanding these patterns cannot be overstated. Candlestick patterns offer traders a way to predict future price movements based on historical data. By recognizing and interpreting these patterns, traders can identify potential entry and exit points, optimize their trading strategies, and enhance their overall market analysis. Among the myriad of candlestick patterns, the Hammer Candlestick Pattern stands out for its reliability and ease of identification.
Hammer candlestick pattern meaning
The Hammer Candlestick Pattern is a key indicator in technical analysis, widely recognized for its potential to signal a bullish reversal in a downtrend. This pattern is defined by a single candlestick with a small real body near the top of the trading range, a long lower shadow that is at least twice the length of the body, and little to no upper shadow. The pattern's name, "Hammer," aptly describes its shape, resembling a hammer with its handle (the long lower shadow) and head (the small body).
The formation of the Hammer Candlestick Pattern occurs when, after a period of declining prices, the market opens and then experiences significant selling pressure. However, the downward momentum is met with strong buying interest, pushing the price back up towards the opening level. The resulting candlestick reflects this battle between buyers and sellers, with the long lower shadow indicating that sellers were initially in control but ultimately overpowered by buyers.
In technical analysis, the Hammer Candlestick Pattern is of great importance because it provides a visual cue that the market sentiment might be shifting. When observed at the bottom of a downtrend, it suggests that the prevailing bearish trend may be losing strength, and a bullish reversal could be imminent. Traders use this pattern to identify potential entry points for long positions, particularly when it is confirmed by other technical indicators or patterns.
Types of Hammer candlestick patterns
Bullish Hammer
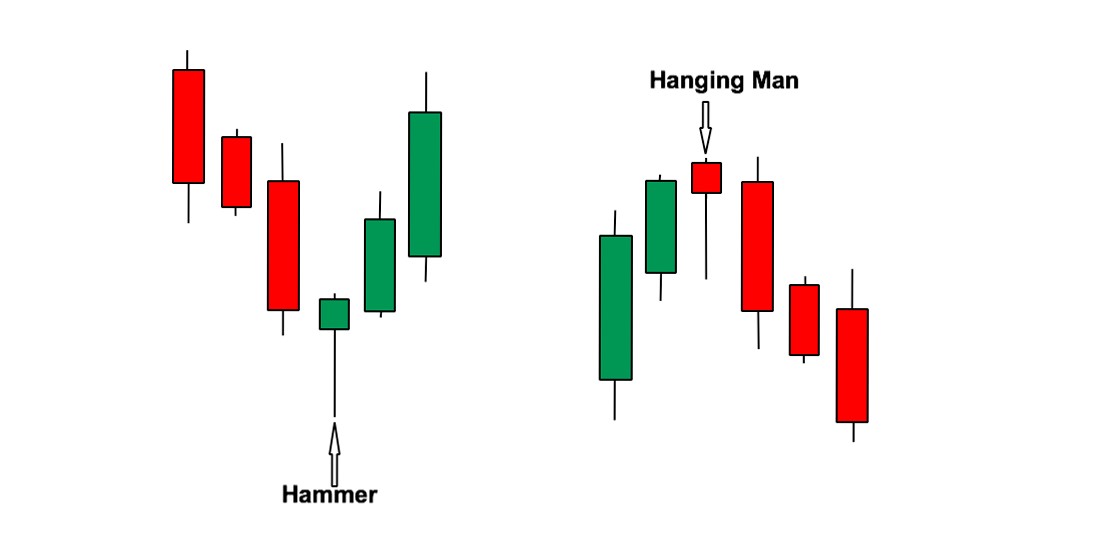
The Bullish Hammer is a classic hammer candlestick pattern that signals a potential reversal in a downtrend. It features a small real body near the top of the trading range, a long lower shadow, and little to no upper shadow. The long lower shadow indicates that sellers initially drove prices lower, but strong buying pressure pushed the price back up, closing near the opening level. This pattern suggests that the downtrend may be losing momentum and that buyers are gaining control, making it a key indicator for traders looking to enter long positions.
Inverted Hammer
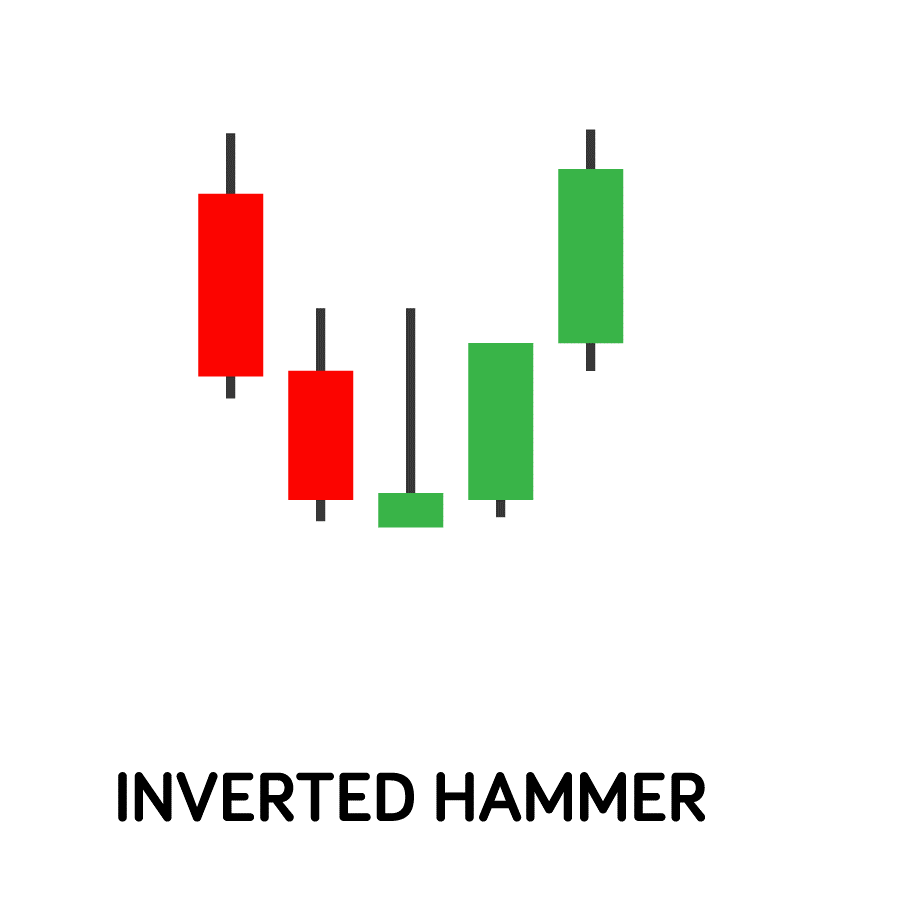
The Inverted Hammer is similar to the Bullish Hammer but appears after a downtrend and signals a potential bullish reversal. It has a small real body near the bottom of the trading range, a long upper shadow, and little to no lower shadow. This pattern forms when buyers push prices higher during the trading session, but sellers bring the price back down towards the opening level. Despite closing lower than the intra-day high, the strong buying pressure suggests a potential reversal, especially if confirmed by subsequent bullish candles.
Hanging Man
The Hanging Man pattern appears after an uptrend and is a bearish reversal signal. It resembles the Bullish Hammer but forms at the top of an uptrend. It has a small real body near the top of the trading range, a long lower shadow, and little to no upper shadow. The long lower shadow indicates that sellers drove prices significantly lower during the session, but buyers managed to push the price back up. Despite this recovery, the presence of selling pressure raises concerns about the sustainability of the uptrend, signaling a potential reversal.
Shooting Star
The Shooting Star pattern is a bearish reversal signal that appears after an uptrend. It features a small real body near the bottom of the trading range, a long upper shadow, and little to no lower shadow. The pattern forms when buyers push prices higher initially, but strong selling pressure brings the price back down towards the opening level. This reversal from the session's high to a close near the opening price suggests that the uptrend may be weakening and that a bearish reversal could be imminent. Traders often use this pattern to identify potential short-selling opportunities.
What is a Hammer candlestick pattern?
The Hammer Candlestick Pattern is a single-candle formation that appears at the bottom of a downtrend, indicating a potential bullish reversal. It is characterized by a small real body located at the upper end of the trading range, a long lower shadow that is at least twice the length of the body, and little to no upper shadow. This pattern suggests that despite initial selling pressure, buyers have stepped in forcefully, pushing the price back up and potentially reversing the downtrend.
A detailed explanation of the Hammer pattern involves understanding its psychological implications. The long lower shadow represents the market's attempt to continue the downtrend, but the small real body and lack of an upper shadow indicate that buyers were able to counteract this pressure and close the price near or above the opening level. This shift from sellers to buyers signals a possible end to the downtrend and the beginning of an upward movement.
Distinguishing between the Hammer and similar patterns is crucial for accurate analysis. Unlike the Hammer, the Hanging Man appears at the top of an uptrend and signals a potential bearish reversal. The Inverted Hammer, while also a bullish reversal signal, has a long upper shadow and forms at the bottom of a downtrend. The Shooting Star, similar to the Inverted Hammer but forming at the top of an uptrend, indicates a bearish reversal.
Real-world examples highlight the practical use of the Hammer pattern. For instance, in March 2020, the EUR/USD currency pair formed a Hammer candlestick on the daily chart, signaling a bullish reversal after a prolonged downtrend. The pattern was confirmed by subsequent bullish candles, leading to a significant upward move. Such historical instances underscore the importance of recognizing and interpreting the Hammer pattern for successful trading strategies.
How to use Hammer candlestick patterns in trading
Identifying Hammer patterns on charts
To identify Hammer candlestick patterns on charts, traders should look for a small real body at the top of the trading range with a long lower shadow, indicating a significant price drop followed by a strong recovery. This pattern typically appears at the bottom of a downtrend. The absence or minimal presence of an upper shadow further confirms the Hammer pattern. Using candlestick charting software can help in spotting these patterns accurately.
Interpreting the significance of Hammer patterns
The significance of Hammer patterns lies in their ability to signal a potential bullish reversal. When a Hammer appears after a sustained downtrend, it suggests that sellers are losing control and buyers are gaining strength. This shift in market sentiment can indicate that the downtrend is coming to an end, and an upward movement might be imminent. Traders often look for confirmation through subsequent bullish candles or other technical indicators before acting on a Hammer pattern.
Entry and exit strategies based on Hammer patterns
Traders use Hammer patterns to inform their entry and exit strategies. Upon identifying a Hammer at the bottom of a downtrend, traders might enter a long position if the next candle confirms the reversal by closing above the Hammer's closing price. It's crucial to wait for this confirmation to avoid false signals. Exit strategies can be based on setting profit targets at key resistance levels or using trailing stops to lock in profits as the price moves upward. Additionally, observing other technical indicators such as moving averages or Relative Strength Index (RSI) can provide further validation for the trade.
Risk management considerations
Effective risk management is essential when trading Hammer patterns. Traders should set stop-loss orders below the low of the Hammer candle to limit potential losses if the reversal does not occur. Position sizing is another crucial aspect; traders should avoid risking more than a small percentage of their trading capital on a single trade. Diversifying trades across different assets and time frames can also mitigate risks. Additionally, it’s important to consider market conditions and avoid trading solely based on Hammer patterns during highly volatile or uncertain periods.
Common mistakes
Misidentification of patterns
One of the most common mistakes traders make is misidentifying Hammer patterns. A true Hammer pattern has a small real body at the top of the trading range and a lower shadow at least twice the length of the body, with little to no upper shadow. Misidentification can occur if the lower shadow is too short or if there is a significant upper shadow, leading to incorrect trading decisions. Traders must ensure they correctly identify the pattern to avoid entering trades based on false signals.
Over-reliance on Hammer Patterns without other indicators
Another pitfall is the over-reliance on Hammer patterns without considering other technical indicators. While Hammer patterns can be a strong signal of potential reversals, relying solely on them can be risky. Effective trading strategies often incorporate multiple indicators, such as moving averages, RSI, or MACD, to confirm the validity of a Hammer pattern. For instance, a Hammer pattern followed by a bullish crossover in the moving average can provide stronger confirmation of a potential upward movement. Integrating various indicators helps in filtering out false signals and enhances the reliability of trading decisions.
Ignoring market context
Ignoring the broader market context when trading Hammer patterns can lead to suboptimal results. Market conditions, such as trends, volatility, and economic events, play a crucial role in the effectiveness of Hammer patterns. For example, a Hammer pattern in a strong downtrend might not result in a sustained reversal if overall market sentiment remains bearish. Similarly, during periods of high volatility, the pattern may produce false signals. Traders should consider the prevailing market environment and any significant news or events that might impact price movements. This holistic approach ensures that Hammer patterns are used effectively and in alignment with broader market trends.
Conclusion
Hammer candlestick patterns are invaluable tools in forex trading, providing critical insights into potential market reversals. These patterns are easily recognizable and offer traders a visual cue that a downtrend may be losing momentum and that a bullish reversal could be on the horizon. By understanding and effectively utilizing Hammer patterns, traders can enhance their ability to make informed decisions, optimize entry and exit points, and ultimately improve their trading outcomes.
The significance of Hammer candlestick patterns lies in their simplicity and reliability. They serve as a clear indicator of market sentiment shifts, allowing traders to anticipate changes in price direction. When combined with other technical indicators and a comprehensive analysis of market conditions, Hammer patterns become even more powerful. This multi-faceted approach helps traders filter out false signals and confirm the validity of potential trades, leading to more robust trading strategies.