Know all about Doji candlestick pattern
Among the various candlestick patterns, the Doji Candlestick Pattern holds particular significance due to its unique structure and the valuable information it conveys. A Doji Candlestick Pattern occurs when the opening and closing prices of an asset are virtually identical, resulting in a very small or nonexistent body with long upper and lower shadows. This pattern indicates a state of indecision in the market, where neither buyers nor sellers have gained control. Recognizing and interpreting Doji patterns can help traders identify potential turning points and make more strategic trading decisions.
What is a Doji candlestick pattern?
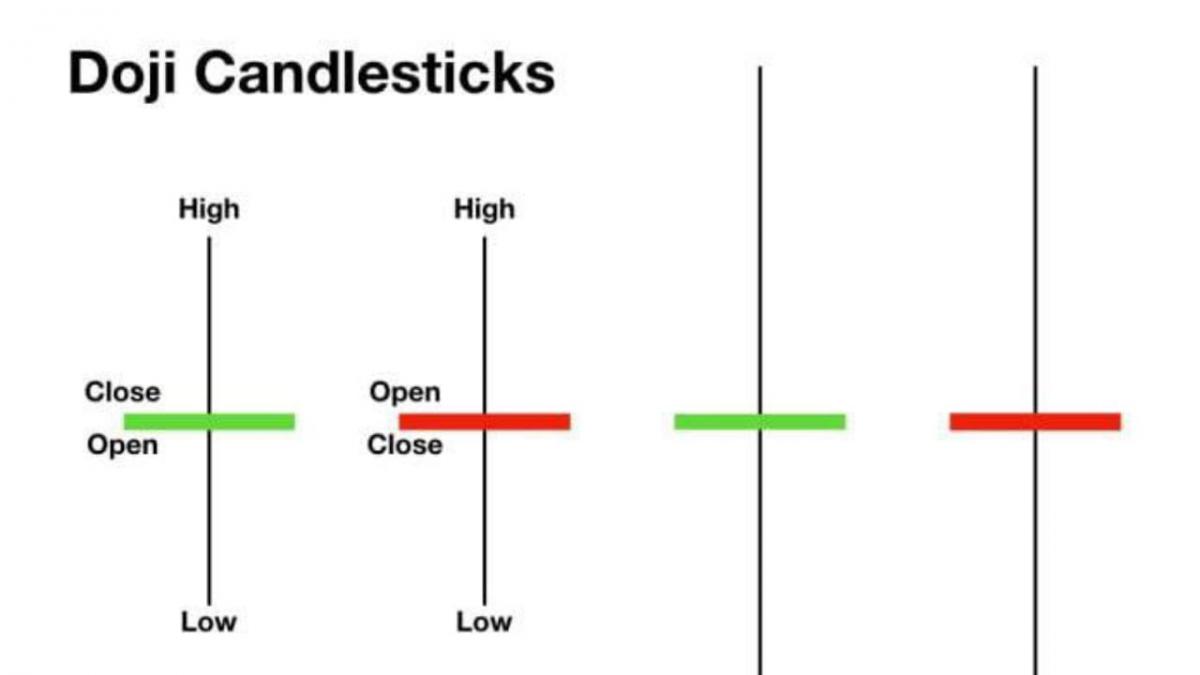
A Doji Candlestick Pattern is a unique formation in candlestick charting where the opening and closing prices of an asset are almost identical. This results in a very small or nonexistent body, flanked by upper and lower shadows of varying lengths. The distinguishing feature of a Doji is its narrow body, which signifies a state of equilibrium between buyers and sellers. This balance suggests that market participants are indecisive, creating an opportunity for traders to anticipate potential price movements.
The visual structure of a Doji consists of a horizontal line, representing the nearly equal opening and closing prices, with thin vertical lines above and below, known as wicks or shadows. These shadows indicate the highest and lowest prices reached during the trading period. Depending on the length of the shadows and the position of the horizontal line, Dojis can take various forms, such as the long-legged Doji, dragonfly Doji, and gravestone Doji, each offering different market insights.
The origin of candlestick patterns, including the Doji, traces back to 18th-century Japan. Munehisa Homma, a rice trader, is credited with developing this charting technique to analyze the price movements of rice contracts. Homma's innovative method provided a way to visually represent market psychology and sentiment, concepts that remain relevant in modern financial markets.
Types of Doji candlestick patterns
Understanding the different types of Doji candlestick patterns can enhance a trader's ability to interpret market signals. Each variant of the Doji offers unique insights into market sentiment and potential price movements.
Standard Doji: The standard Doji is characterized by its small body, where the opening and closing prices are nearly identical. It reflects a state of indecision, with neither buyers nor sellers able to gain control. This pattern can signal a potential reversal or continuation, depending on the preceding trend and confirmation from subsequent candlesticks.
Long-legged Doji: The long-legged Doji features extended upper and lower shadows, indicating significant volatility within the trading period. The long shadows suggest that prices moved substantially higher and lower before settling near the opening price. This pattern often appears during periods of uncertainty and can precede major price movements as the market seeks direction.
Dragonfly Doji: The dragonfly Doji has a long lower shadow and little to no upper shadow, with the open and close occurring at or near the high of the day. This pattern indicates that sellers pushed prices lower, but buyers regained control, bringing the price back up. It can be a bullish reversal signal, especially after a downtrend.
Gravestone Doji: The gravestone Doji is the opposite of the dragonfly, with a long upper shadow and no lower shadow. The open and close prices are at or near the low of the day. This pattern suggests that buyers drove prices up, but sellers overpowered them, pushing the price back down. It is often seen as a bearish reversal signal after an uptrend.
Four-Price Doji: The four-price Doji is rare and occurs when the open, high, low, and close prices are the same, resulting in a single horizontal line. This pattern indicates extreme indecision and a complete balance between buyers and sellers. It typically appears in very low-volume markets and may not provide significant predictive value on its own.
What Does a Doji candle indicate?
A Doji candlestick is a powerful indicator of market indecision. When a Doji forms, it signals that the forces of supply and demand are in equilibrium. This balance suggests that neither buyers nor sellers have the upper hand, leading to uncertainty about the future direction of the market. Traders interpret this indecision as a sign that the current trend might be losing momentum, potentially setting the stage for a reversal.
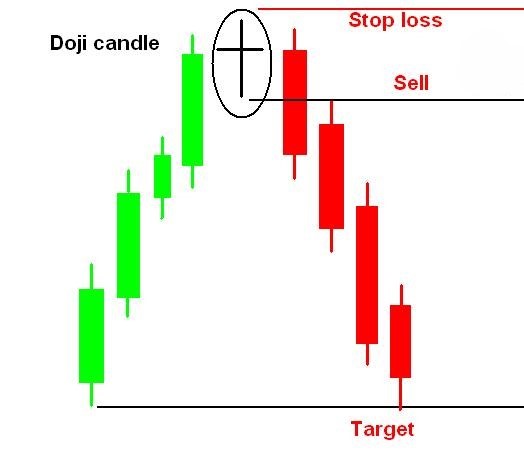
One of the key implications of a Doji candlestick is the possibility of a market reversal. In an uptrend, a Doji can indicate that buying pressure is weakening and that sellers may soon take control, leading to a downward price movement. Conversely, in a downtrend, a Doji suggests that selling pressure is diminishing and buyers could drive the price higher. However, it is crucial for traders to seek confirmation from subsequent candlesticks or other technical indicators before acting on a potential reversal signaled by a Doji.
The significance of a Doji candle varies depending on the prevailing market conditions. In a bullish market, the appearance of a Doji after a series of strong upward movements may suggest that buyers are becoming cautious, hinting at a possible trend change. In a bearish market, a Doji after sustained downward movement can indicate that selling pressure is waning, potentially signaling a trend reversal. Regardless of the market condition, the Doji candlestick provides valuable insights into market sentiment and helps traders anticipate possible shifts in direction.
Interpreting Doji candlestick patterns in forex trading
A Doji appearing in an uptrend can signal that the bullish momentum is waning. Traders often view this as a warning sign that buyers may be losing strength, possibly leading to a bearish reversal. Conversely, a Doji in a downtrend indicates that sellers may be exhausting their efforts, suggesting a potential bullish reversal as buyers begin to reassert themselves.
To effectively utilize Doji patterns, traders must look for confirmation signals. A single Doji is not sufficient to make a trading decision; it should be corroborated by subsequent price action or other technical indicators. For instance, in an uptrend, if a Doji is followed by a bearish candlestick, it confirms a reversal signal, increasing the likelihood of a downward move. Similarly, in a downtrend, a Doji followed by a bullish candlestick strengthens the case for an upward reversal.
Historical forex charts provide valuable examples of Doji patterns and their implications. For instance, on June 12, 2020, the EUR/USD pair formed a Doji after a prolonged uptrend. The subsequent bearish candle confirmed a reversal, leading to a significant price drop. Another example is the GBP/USD pair on March 23, 2021, where a Doji appeared at the bottom of a downtrend. The following bullish candle indicated a reversal, resulting in a notable upward movement.
Trading strategies using Doji candlestick patterns
Trading strategies that incorporate Doji candlestick patterns can be highly effective in anticipating market movements. Understanding how to use these patterns in various contexts can provide traders with a significant edge.
Reversal strategy: One common strategy is to use Doji patterns to identify potential reversals. When a Doji appears after a sustained uptrend, it signals that buying pressure might be waning. Traders can prepare for a possible downward reversal, especially if the Doji is followed by a bearish candlestick. Conversely, a Doji after a prolonged downtrend suggests that selling pressure may be diminishing, hinting at a potential upward reversal. Confirmation from subsequent price action is crucial before making a trade based on these signals.
Continuation strategy: In some cases, a Doji can signal a continuation of the current trend rather than a reversal. If a Doji forms within a strong trend and is followed by a candlestick that moves in the direction of the trend, it can reinforce the trend's continuation. For instance, in a strong uptrend, a Doji followed by a bullish candle can suggest the trend will persist.
Combining Doji patterns with other technical indicators: To enhance the reliability of Doji signals, traders often combine them with other technical indicators. For example, using moving averages can help determine the overall trend direction. If a Doji forms above a rising moving average, it might signal a continuation of the uptrend. The Relative Strength Index (RSI) can also be useful; an overbought or oversold RSI reading in conjunction with a Doji can provide strong reversal signals.
Risk management techniques: Effective risk management is essential when trading Doji patterns. Traders should set stop-loss orders to limit potential losses in case the market moves against their position. It's also wise to determine the position size based on the level of risk one is willing to take. Diversifying trades and not relying solely on Doji patterns can help mitigate risks. Monitoring the overall market context and remaining flexible in strategy adjustments based on evolving market conditions is also crucial.
Advantages and limitations of Doji candlestick patterns
Benefits: Doji candlestick patterns provide valuable insights into market indecision, making them useful for predicting potential reversals or continuations. Their simplicity and clear visual representation make them accessible for traders of all experience levels. When combined with other technical indicators, Doji patterns can enhance the accuracy of trading signals and strategies.
Common limitations: Despite their usefulness, Doji patterns can produce false signals, especially in low-volume markets. Relying solely on Doji patterns without confirmation from other indicators can lead to premature or incorrect trading decisions. Additionally, interpreting Doji patterns requires context, as their significance can vary based on the preceding trend and overall market conditions.
Conclusion
Incorporating Doji candlestick patterns into trading strategies is essential for understanding market sentiment and potential price movements. These patterns offer clear signals of indecision and can indicate potential reversals or continuations, providing traders with crucial insights. However, to maximize their effectiveness, Doji patterns should be used in conjunction with other technical indicators and confirmation signals.