How to trade shooting star candlestick
In the realm of forex trading, understanding and interpreting candlestick patterns is crucial for making informed trading decisions. One such pattern that traders frequently rely on is the shooting star candlestick. Recognizing and correctly analyzing this pattern can significantly enhance a trader's ability to predict market movements and capitalize on potential reversals.
Candlestick patterns, including the shooting star, hold significant importance in forex trading due to their ability to visually represent market psychology and sentiment. These patterns provide insights into the potential future direction of prices, helping traders to anticipate and react to market changes.
Understanding the shooting star candlestick
The shooting star candlestick is a crucial pattern for traders seeking to identify potential bearish reversals in the forex market. Recognizing its characteristics and understanding its formation can aid traders in making more informed decisions.
Characteristics of a shooting star candlestick
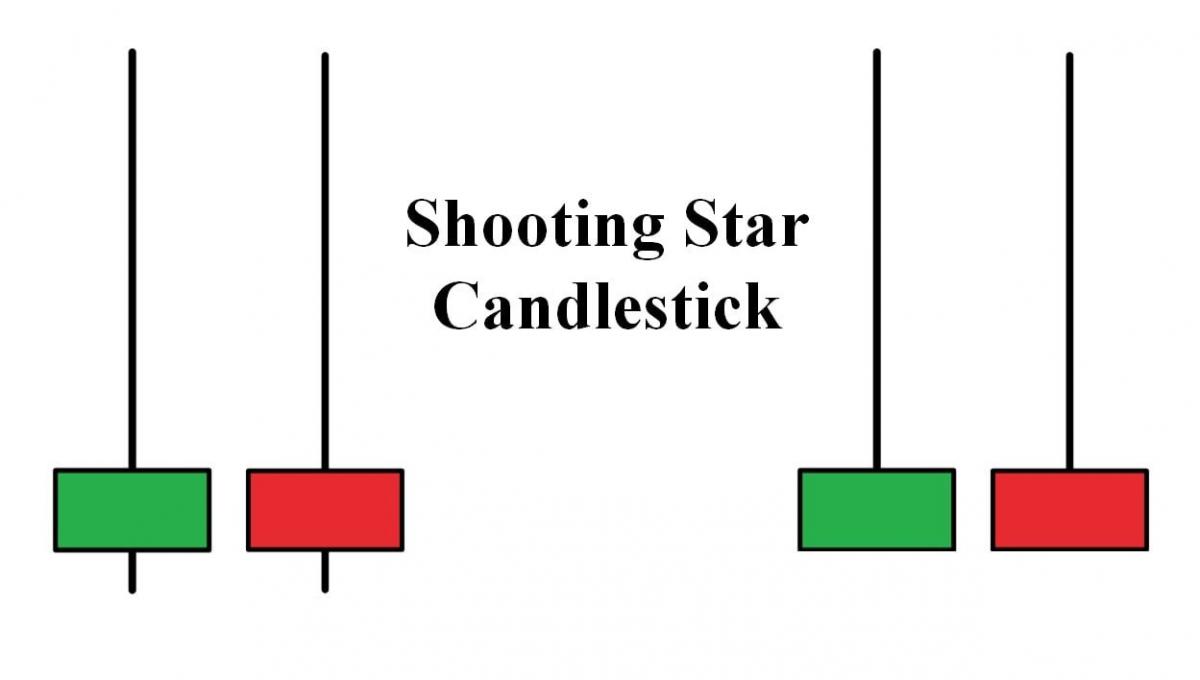
A shooting star candlestick typically appears at the peak of an uptrend and is characterized by:
- A small real body located at the lower end of the trading range.
- A long upper shadow, which should be at least twice the length of the body.
- Little to no lower shadow, indicating that the open and close prices are close together. This structure suggests that the market initially moved upwards but faced significant resistance, resulting in a close near the opening price.
Formation of the shooting star pattern
The shooting star forms when buyers initially drive the price up, creating a long upper shadow. However, as the session progresses, sellers regain control, pushing the price back down toward the opening level. This shift in control from buyers to sellers signifies potential bearish sentiment, making the shooting star a useful indicator of a possible trend reversal.
Difference between shooting star and other similar candlesticks
The shooting star is often compared to other candlesticks, such as the inverted hammer and doji. While the inverted hammer also has a small body and a long upper shadow, it typically appears at the bottom of a downtrend, indicating a bullish reversal. On the other hand, a doji has little to no real body and signifies market indecision rather than a clear reversal. Understanding these differences helps traders accurately identify the shooting star and avoid potential misinterpretations.
Significance of the shooting star candlestick in forex trading
The shooting star candlestick is highly valued among forex traders for its ability to signal potential reversals in an uptrend. Its significance lies in the insight it provides into market sentiment and future price movements.
Indications of market sentiment
The shooting star candlestick indicates a shift in market sentiment from bullish to bearish. Initially, buyers drive the price up, reflected by the long upper shadow. However, the sellers' subsequent push to close the price near the opening level demonstrates a loss of upward momentum and increasing bearish pressure. This reversal in sentiment often leads traders to anticipate further downward movement, prompting strategic sell positions.
Typical market conditions where shooting star candlestick appears
The shooting star candlestick typically appears at the top of an uptrend or near resistance levels, signaling the potential end of a bullish run. It is more reliable when it forms after a sustained price increase, as it indicates exhaustion among buyers and a possible influx of selling pressure. The appearance of this pattern during overbought conditions, as identified by technical indicators like the Relative Strength Index (RSI), further strengthens its bearish implications.
Historical performance and reliability
Historically, the shooting star candlestick has proven to be a reliable predictor of trend reversals, particularly when confirmed by other technical analysis tools and indicators. Studies and backtesting have shown that trades based on this pattern, combined with appropriate risk management strategies, can yield favorable results. However, like all technical patterns, its reliability improves when used in conjunction with other indicators and within the context of broader market analysis. Relying solely on the shooting star without additional confirmation can lead to false signals and suboptimal trading decisions.
How to identify a shooting star candlestick
Identifying a shooting star candlestick accurately is crucial for effectively using this pattern in forex trading. Recognizing its key visual features, understanding the most effective time frames, and confirming its presence with technical analysis tools are essential steps in this process.
Key visual features to look for
A shooting star candlestick is easily recognizable by its distinctive shape:
- Small real body: The body is small and positioned at the lower end of the trading range.
- Long upper shadow: The upper shadow should be at least twice the length of the body, indicating that the price was pushed significantly higher but failed to maintain those levels.
- Little to no lower shadow: This suggests that the closing price is close to the opening price, reflecting a lack of follow-through by buyers.
These features collectively signify a potential bearish reversal, with initial buyer enthusiasm being overwhelmed by selling pressure.
Time frames where shooting star patterns are most effective
The effectiveness of the shooting star pattern varies across different time frames. It is most reliable on longer time frames, such as daily or weekly charts, where the pattern reflects significant market sentiment and potential trend reversals. While it can also appear on shorter time frames like hourly charts, the signals may be less reliable due to market noise and volatility.
Using technical analysis tools to confirm identification
To enhance the reliability of a shooting star pattern, traders often use additional technical analysis tools for confirmation. Indicators such as the Relative Strength Index (RSI) can help determine if the market is in an overbought condition, strengthening the bearish signal of the shooting star. Moving averages can also provide context by highlighting overall trend direction. Volume analysis can further confirm the pattern's validity; a shooting star with high trading volume suggests stronger selling pressure and a more credible reversal signal.
Trading strategies using the shooting star candlestick
Effectively trading the shooting star candlestick involves utilizing specific strategies to capitalize on its bearish reversal signals. Key strategies include determining entry and exit points, using additional indicators for confirmation, implementing risk management techniques, and learning from successful trade examples.
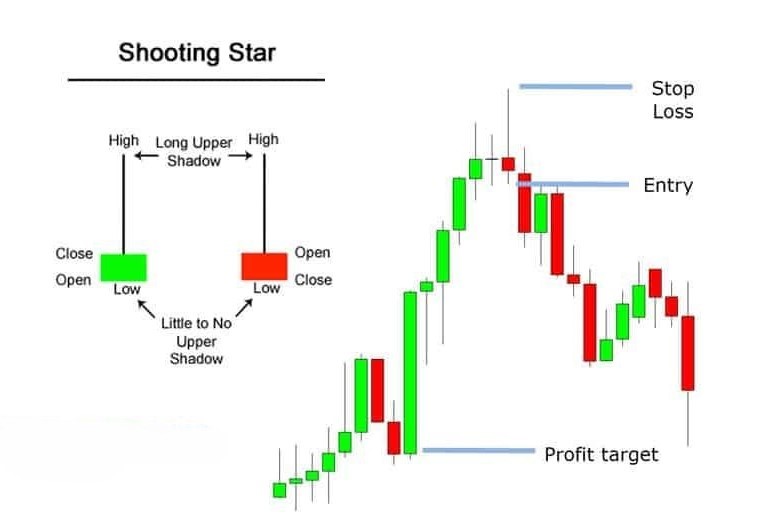
Reversal strategy: Entry and exit points
The primary trading strategy with a shooting star candlestick focuses on bearish reversals. Traders typically enter a short position after the confirmation of the shooting star pattern. This confirmation often comes with the appearance of a bearish candle following the shooting star. The ideal entry point is just below the low of the shooting star candlestick. The exit point should be determined based on the next significant support level or the trader's risk-reward ratio.
Confirmation strategy: Using additional indicators
For enhanced accuracy, traders should use additional technical indicators to confirm the shooting star signal:
- Moving Averages: The appearance of a shooting star near a major moving average (e.g., 50-day or 200-day) can validate the bearish reversal.
- Relative Strength Index (RSI): An overbought RSI reading (>70) concurrent with a shooting star increases the likelihood of a reversal.
- Volume Analysis: A shooting star accompanied by high trading volume suggests strong selling pressure, confirming the pattern's validity.
Risk management: Setting stop-loss and take-profit levels
Effective risk management is essential when trading shooting star patterns:
- Stop-Loss: Place a stop-loss order just above the high of the shooting star to limit potential losses if the market reverses unexpectedly.
- Take-Profit: Set take-profit levels based on key support zones or a predefined risk-reward ratio, ensuring profitable trades while managing risk.
Examples of successful trades using the shooting star candlestick
Consider a scenario where a shooting star forms at the peak of an uptrend on a daily chart. Confirming the pattern with an overbought RSI and significant volume, a trader enters a short position below the shooting star's low. Setting a stop-loss just above the shooting star's high and a take-profit at a nearby support level results in a successful trade as the market reverses downward.
Common mistakes and how to avoid them
Misidentifying the pattern, ignoring market context, over-relying on the pattern without confirmation, and failing to follow practical tips can lead to suboptimal trading outcomes.
A frequent mistake is confusing the shooting star with similar candlestick patterns, such as the inverted hammer or doji. The shooting star is characterized by a small real body at the lower end of the trading range and a long upper shadow. To avoid misidentification, ensure the upper shadow is at least twice the length of the body and that there is little to no lower shadow. Cross-referencing with educational resources or using automated pattern recognition tools can help confirm the pattern.
Traders often make the mistake of trading the shooting star in isolation without considering the broader market context. The pattern is most reliable when it appears at the top of an uptrend or near resistance levels. Ignoring prevailing market trends, economic indicators, or geopolitical events can lead to false signals. Always analyze the overall market conditions before acting on a shooting star signal.
Conclusion
The shooting star candlestick is a valuable tool for forex traders, offering insights into potential market reversals. However, its effectiveness is maximized when used in conjunction with a thorough analysis of market context and additional technical indicators. While it can be a powerful signal, relying solely on the shooting star without broader confirmation can lead to false signals.
Successful trading with the shooting star candlestick requires practice and continuous refinement of strategies. Traders should regularly review their trades, analyze outcomes, and adjust their approaches based on their experiences and market changes.
 Afrikaans
 Albanian
 Amharic
 Arabic
 Armenian
 Azerbaijani
 Belarusian
 Bengali
 Bosnian
 Bulgarian
 Catalan
 Cebuano
 Chichewa
 Chinese (Simplified)
 Chinese (Traditional)
 Corsican
 Croatian
 Czech
Czech Danish
 Dutch
Dutch English
 Esperanto
 Estonian
 Filipino
 Finnish
 French
 Frisian
 Galician
 Georgian
 German
 Greek
Greek Gujarati
 Haitian Creole
 Hausa
Hausa Hawaiian
 Hebrew
 Hindi
Hindi Hmong
Hmong Hungarian
 Icelandic
 Igbo
Igbo Indonesian
 Irish
Irish Italian
 Japanese
 Javanese
 Kannada
 Kazakh
 Khmer
Khmer Korean
 Kurdish (Kurmanji)
 Kyrgyz
 Lao
Lao Latin
Latin Latvian
 Lithuanian
 Luxembourgish
 Macedonian
 Malagasy
 Malay
Malay Malayalam
 Maltese
 Maori
Maori Marathi
 Mongolian
 Myanmar (Burmese)
 Nepali
 Norwegian
 Pashto
 Persian
 Polish
 Portuguese
 Punjabi
 Romanian
 Russian
 Samoan
 Scottish Gaelic
 Serbian
 Sesotho
 Shona
Shona Sindhi
 Sinhala
 Slovak
 Slovenian
 Somali
 South Africa
 Spanish
 Sudanese
 Swahili
 Swedish
 Tajik
Tajik Tamil
Tamil Telugu
 Thai
Thai Turkish
 Ukrainian
 Urdu
Urdu Uzbek
Uzbek Vietnamese
 Welsh
Welsh Xhosa
Xhosa Yiddish
 Yoruba
 Zulu
Zulu