Head and Shoulders pattern strategy
Sometimes, you might wish to be able to determine the market turns more accurately? The Head and Shoulders pattern could be your magic tool for this. It is one of the most popular chart patterns in technical analysis; used by both novice and professional traders in the stock, forex, and crypto markets. Why? It is because when it forms, it is likely to indicate a change in the trend. However, there is a catch; like any other strategy, it has to be used at the right time, with a degree of patience, and in the most strategic manner to be able to work in your favor.
In its simplest form, the Head and Shoulders pattern is a trend reversal pattern that is used to determine when a trend is likely to change. It is usually formed after a rise, indicating that buyers have tired and that sellers are likely to take over. It seems like a straightforward concept, but identifying the pattern is only the first step. False breakouts, premature entries, and ill-managed stop-losses can transform what appeared to be a perfect trade into a disastrous loss.
Understanding the Head and Shoulders pattern
If you have ever felt like the market is alive and has a mind of its own, then you are not alone at all. Prices rise, then fall, then rise again, only to drop unexpectedly. It can be annoying, but that is where technical patterns come in. The head and shoulders pattern is not just a set of peaks and troughs on a chart; it is a map of the shift in market psychology.
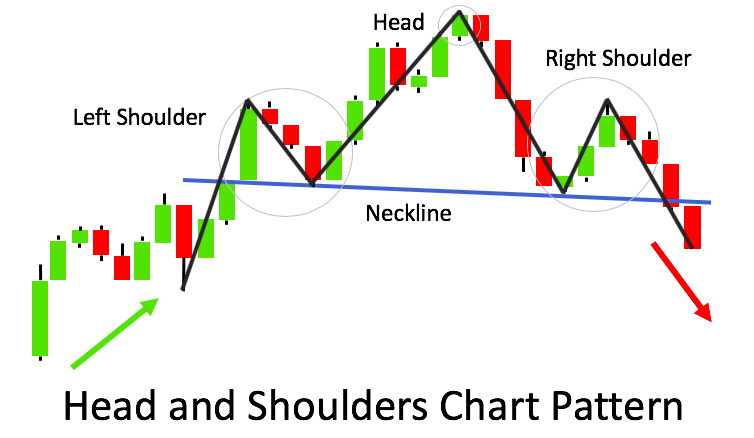
So, how does it work? An uptrend is when buyers are in control and push prices up. At some point, the rate of increase decreases, which creates the left shoulder – a small peak followed by a drop. Then comes the head, a higher high that looks like it might continue the rise… but it doesn’t. Finally, there is the right shoulder, a lower high, which indicates that the bulls are tiring. The important level here is the neckline, which is the horizontal or slightly sloping support line that links the lows between the peaks. When the price moves below this neckline, that’s when traders sit up and take notice; it often means the start of a downtrend.
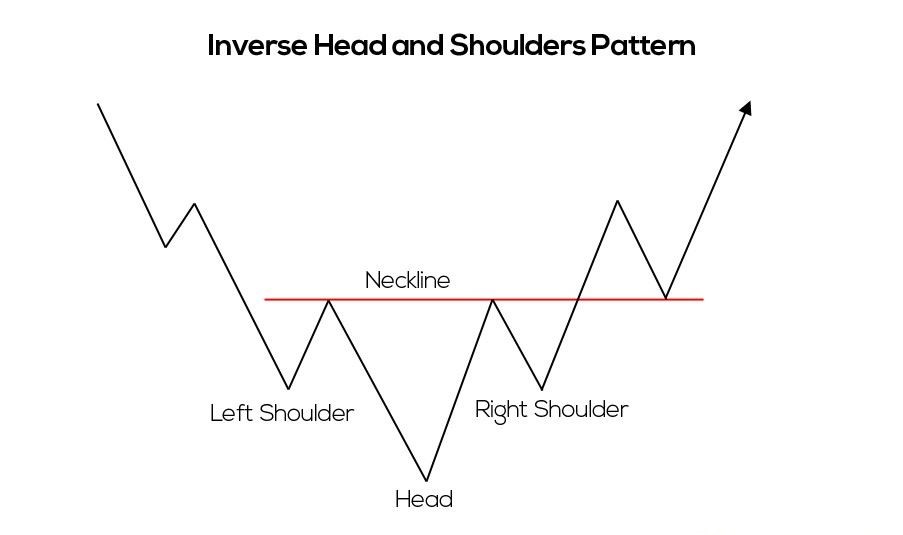
But what about the inverse Head and Shoulders? Same concept, just flipped. Instead of acting as a bearish reversal signal, as this one does, it indicates the shift from a downtrend to an uptrend, with the pattern being formed upside down.
The thing is, not all Head and Shoulders patterns are suitable for trading. At times, the neckline breakthrough is weak. At other times, the price fake out, only to revert.
Identifying the Head and Shoulders pattern on a chart
Analyzing a Head and Shoulders pattern on a live chart is not as easy as it may seem. Of course, it looks rather simple in the retrospective. But when you find yourself in front of the price chart, things are not always so clear-cut; patterns do not always appear in the most straightforward way. That is why it is important to know what to look for.
The first thing to watch for is trend context. The Head and Shoulders pattern is renowned for forming following a bullish trend, thus serving as a signal that the market has probably peaked. If you are seeing a pattern develop in a range or a sideways market, then be careful—the signal may well be wrong.
Then, pay attention to symmetry. A good Head and Shoulders pattern has two shouldered at approximately the same height and a peak (the head) between them. If the right shoulder is higher or lower than the left should or if the neckline is steep, then it may not be good.
Volume, however, is also important. It is preferred that volume declines as the pattern develops, indicating decreasing bullish interest. A rise in volume on the breakdown of the neckline? That’s the signal—sellers have taken over the market.
Timeframe is important as well. The pattern is most effective on higher timeframes (daily, weekly) but can be used on lower timeframes as well. Just be aware—smaller timeframes are more noisy and tend to generate false signals.
Trading strategy for the Head and Shoulders pattern
A Head and Shoulders pattern is easy to recognize but it’s quite difficult to profit from it. Some traders see the pattern, get excited, and enter the market too early, only to see the price come knocking at their doors. The key? Precision and patience.
First of all, let’s talk about entry points. The best entry is made when price moves below the neckline and closes there (for a bearish pattern). If you wish to increase the level of security even further, then wait for the neckline to be tested – a fairly typical phenomenon when the price drops, then rises again to the level indicated by the trend. This decreases the probability of getting caught in a false breakout.
So, what about stop-loss placement? This is where many traders make a wrong decision. A low risk stop is located immediately above the right shoulder, it will only stop your trade if the pattern is considered to fail. A more aggressive stop? Right above the neckline after the retest. Both have their advantages and disadvantages – it really boils down to your risk tolerance.
As for profit targets, the simplest way is to look at the head to neckline distance and extend it lower. But don’t forget—markets aren’t robots. It is quite usual for price to reverse sooner or even continue further than expected.
Real-world examples
Seeing the Head and Shoulders pattern play out in live markets is what truly solidifies its power.
Case study 1: S&P 500 – Classic Bearish Reversal
Back in early 2022, the S&P 500 was riding high, breaking all-time records. Then, cracks started forming. A Head and Shoulders pattern emerged on the daily chart, with the left shoulder around 4,600, the head reaching 4,800, and the right shoulder stalling near 4,650. When price broke the neckline at 4,500, selling pressure accelerated. Those who shorted the breakout saw the index plunge over 15% in the following months—a textbook example of the pattern in action.
Case study 2: EUR/USD – Inverse Head and Shoulders leading a Bullish Reversal
Forex traders saw a similar setup in EUR/USD in late 2022. After a brutal downtrend, price formed an inverse Head and Shoulders on the 4-hour chart. The neckline at 1.0000 (parity level) was a major psychological barrier. When price finally broke above it with strong volume, traders who went long saw EUR/USD climb to 1.0600—a 600-pip rally in just weeks.
Best indicators to use alongside the Head and Shoulders pattern
Markets are noisy and price action can be deceptive. Therefore, experienced traders do not rely only on the pattern itself when making the trade; they use technical indicators to confirm the setup before opening the position.
So, among all the indicators, which ones really help? First of all, let’s talk about Moving Averages (MAs). It can also serve as dynamic support or resistance levels. If the pattern’s neckline lies near a major moving average, then it increases the effectiveness of the breakout. Then there is Volume Analysis. This is a big one. It should be that volume decreases while the pattern develops, which shows decreasing momentum. When price breaks the neckline, however, increased volume confirms that there was power behind the sell (or buy) side – thus making it less likely to be a false breakout. Now, it is time to discuss RSI – Relative Strength Index. If RSI is diverging it means price forms a higher high (in the head), but RSI prints a lower high it is a sign of tired buyers. The same applies in the reverse for an inverse Head and Shoulders.
Finally, there is MACD (Moving Average Convergence Divergence) which is quite useful in determining the entry points. A bearish MACD crossover, for instance, would be appropriate for a standard H&S structure, while a bullish one would be appropriate for an inverse H&S structure.
Conclusion
So, is the Head and Shoulders pattern worth using? Absolutely—but only if you approach it with the right mindset. Like any trading strategy, it’s not a magic formula for success. It’s a tool—one that, when used correctly, can provide high-probability trade setups with solid risk-to-reward potential.
The key takeaway? Confirmation is everything. Just because you spot a pattern doesn’t mean you should immediately jump into a trade. Wait for the neckline break. Check volume. Look for additional confluence, whether it’s RSI divergence, a MACD crossover, or a strong moving average rejection. The more signals that align, the stronger your trade setup.
Risk management is equally important. No setup—no matter how perfect it looks—is guaranteed to work. That’s why placing a well-thought-out stop-loss (above the right shoulder for a bearish setup, below it for an inverse H&S) is crucial. You don’t want a single bad trade wiping out weeks of gains.
And let’s not forget the bigger picture. The best Head and Shoulders patterns form in clear market trends, not in random price action. If the broader market conditions don’t support your trade idea, reconsider your position.