Harmonic patterns in forex
Harmonic patterns in forex are advanced chart patterns that help traders identify potential market reversals with a high degree of accuracy. Rooted in the principles of geometry and Fibonacci ratios, these patterns analyze price movements to forecast future trends. Unlike traditional chart patterns such as head and shoulders or double tops, harmonic patterns rely heavily on precise mathematical measurements, particularly Fibonacci retracement and extension levels, to define their structure.
The concept of harmonic trading was first popularized by H.M. Gartley in the 1930s, with further refinements by traders like Scott Carney, who introduced specific patterns such as the Bat and the Crab. Over time, harmonic patterns have evolved into a sophisticated tool for technical analysis, widely adopted by traders across various financial markets, including forex.
What sets harmonic patterns apart is their ability to provide objective entry and exit points. By identifying specific price formations that align with Fibonacci ratios, traders can anticipate market reversals before they occur.
The core principles behind harmonic patterns
Harmonic patterns in forex are built on the foundation of precise mathematical relationships, primarily through the use of Fibonacci ratios. These ratios, such as 0.618, 0.786, 1.272, and 1.618, are derived from the Fibonacci sequence and play a crucial role in determining the structure of harmonic chart patterns. Traders use these ratios to identify key reversal zones, where the price is likely to change direction based on historical price behaviour.
One of the core principles behind harmonic patterns is the concept of symmetry in price movements. Markets often move in repetitive cycles influenced by investor psychology, economic events, and supply-demand dynamics. Harmonic patterns aim to capture these cycles by identifying geometrically proportionate price swings, creating visually distinct formations like the Gartley, Bat, and Butterfly patterns.
Another critical element is price action confirmation. While harmonic patterns provide a framework for potential trade setups, traders rely on additional technical indicators—such as RSI (Relative Strength Index) or MACD (Moving Average Convergence Divergence)—to confirm whether a pattern will hold or fail.
Harmonic patterns appeal to forex traders because they offer a structured, rule-based approach to technical analysis. Unlike subjective chart interpretations, harmonic trading requires strict adherence to pattern criteria, reducing emotional biases.
Types of harmonic patterns in forex
Harmonic patterns in forex come in various forms, each with distinct characteristics defined by specific Fibonacci ratios. Understanding these patterns can help traders identify potential reversal zones and optimize entry and exit points. Here are some of the most commonly used harmonic patterns in forex trading:
Gartley pattern
The Gartley pattern, introduced by H.M. Gartley in his book “Profits in the Stock Market”, is one of the earliest harmonic patterns. It forms when a price trend retraces and then continues in its original direction, creating an "M" or "W" shape. Key Fibonacci levels include a 61.8% retracement of the initial XA leg, with subsequent legs (AB, BC, and CD) adhering to specific ratios. Traders often use this pattern to spot high-probability reversal zones in trending markets.
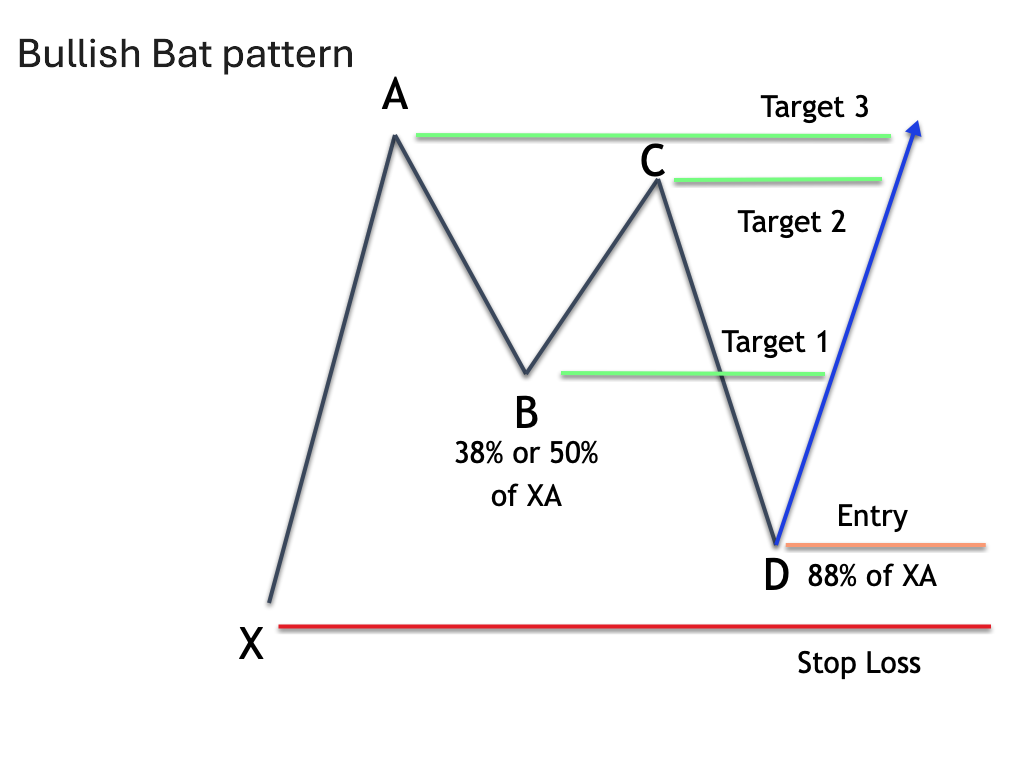
Bat pattern
Developed by Scott Carney, the Bat pattern is similar to the Gartley but features a deeper retracement in the B leg—typically around 50% of the XA leg. The completion of the CD leg near the 88.6% Fibonacci retracement of XA indicates a potential reversal. The Bat pattern is highly valued for its precision and low-risk trade setups.
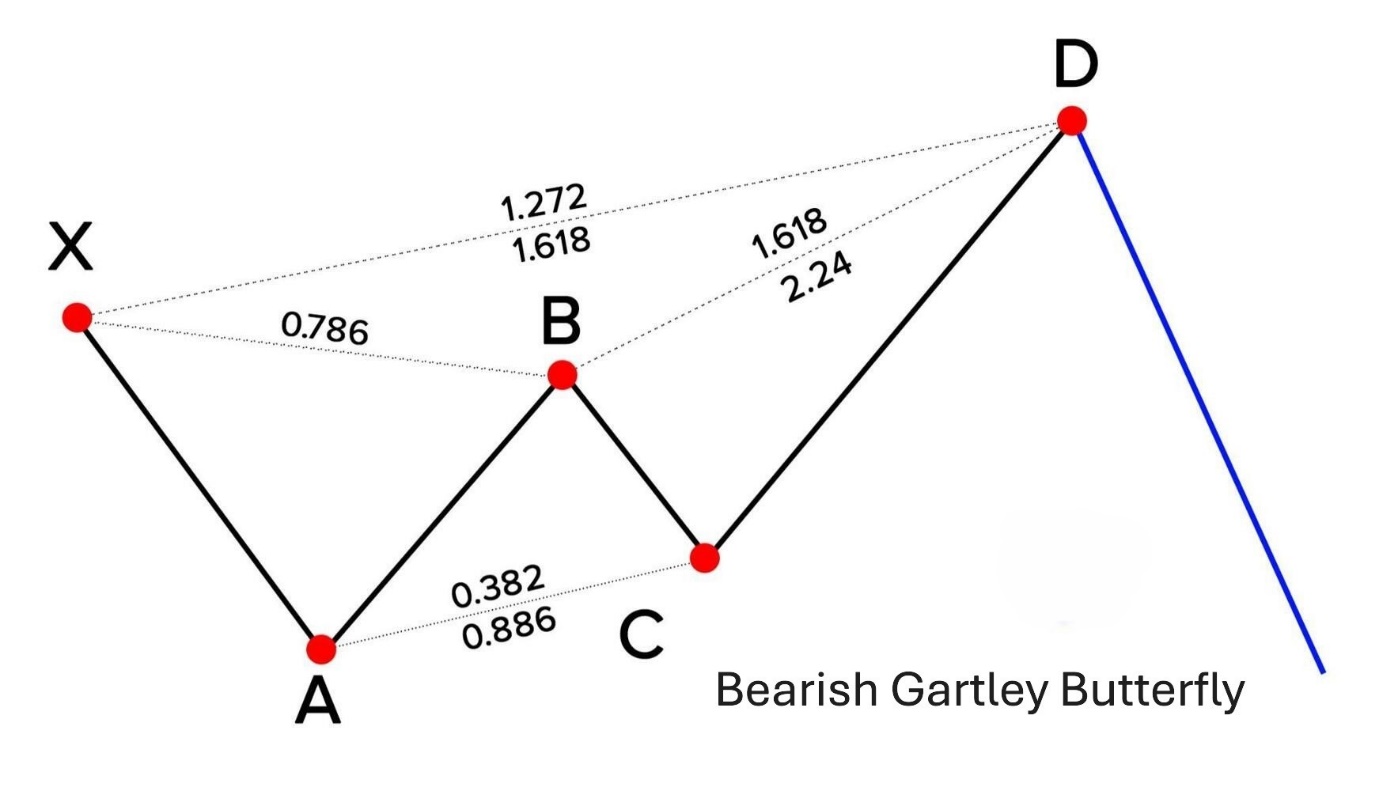
Butterfly pattern
The Butterfly pattern differs from the Gartley and Bat by extending beyond the original XA leg. The key Fibonacci extension is the 127.2% or 161.8% level, making it effective for identifying trend exhaustion points.
Crab and cypher patterns
The Crab pattern emphasizes extreme Fibonacci extensions, up to 161.8% of the XA leg, while the Cypher pattern, a newer formation, offers flexibility with its unique retracement and extension ratios. Both patterns are effective in volatile market conditions.
How to identify harmonic patterns on forex charts
Identifying harmonic patterns on forex charts requires a combination of technical analysis skills and the use of specific tools to accurately measure price movements. The process begins with recognizing distinct price swings, often labelled as XA, AB, BC, and CD, which form the structure of patterns like the Gartley, Bat, Butterfly, and Crab.
This is the first significant price movement, either bullish or bearish, that sets the foundation for the pattern.
Using Fibonacci retracement tools, determine if the AB leg retraces a specific portion of the XA leg, typically between 38.2% and 61.8%.
The BC leg moves in the opposite direction of AB, often retracing 38.2% to 88.6% of AB.
This leg completes the pattern, extending to key Fibonacci levels like 127.2% or 161.8% of BC, depending on the pattern type.
Tools for identifying harmonic patterns:
Platforms like MetaTrader (MT4/MT5) and TradingView offer built-in Fibonacci retracement and extension tools, making it easier to map these patterns accurately. Additionally, harmonic pattern recognition software and indicators can automate the process, highlighting potential setups in real time.
Common mistakes to avoid:
Ignoring precise Fibonacci ratios: Patterns that don’t align with exact ratios may produce unreliable signals.
Overlooking market context: Patterns are more effective when confirmed with other technical indicators like RSI or MACD.
Forcing patterns: Traders sometimes see patterns where none exist, leading to poor trade decisions.
Harmonic patterns strategy for forex traders
The goal is to identify high-probability reversal zones where price movements are likely to change direction based on precise Fibonacci ratios.
Developing a trading strategy with harmonic patterns:
Pattern recognition: Begin by identifying harmonic patterns such as the Gartley, Bat, Butterfly, or Crab on forex charts. Use Fibonacci retracement and extension tools to confirm that the price movements align with specific ratios.
Entry and exit points: The potential reversal zone (PRZ) is where the CD leg completes, often signaling an entry point. Traders place buy or sell orders near this zone, depending on the pattern’s bullish or bearish nature. Profit targets are typically set at key Fibonacci levels of the prior legs, such as 38.2% or 61.8% retracements.
Confirmation with indicators: To enhance the reliability of trade setups, combine harmonic patterns with momentum indicators like the Relative Strength Index (RSI), Moving Average Convergence Divergence (MACD), or stochastic oscillators. These tools help confirm whether the market conditions support the anticipated reversal.
Risk management techniques:
Stop-loss placement: Always set stop-loss orders just beyond the PRZ to limit potential losses if the pattern fails.
Position sizing: Adjust trade size based on risk tolerance and account size, following principles like the 1-2% rule to manage exposure.
Case study insight:
For instance, a trader spotting a bullish Bat pattern on the EUR/USD pair could enter near the PRZ, confirm with RSI divergence, and set profit targets based on prior retracement levels. This structured approach increases consistency and reduces emotional mistakes in unstable forex markets.
Advantages and limitations of harmonic patterns in forex
Harmonic patterns offer several advantages to forex traders, primarily due to their structured, rule-based approach to market analysis. However, like all trading tools, they also come with limitations that traders should consider when incorporating them into their strategies.
Advantages of harmonic patterns:
Harmonic patterns rely on specific Fibonacci ratios, allowing traders to identify potential reversal zones (PRZ) with a high degree of accuracy. This precision helps in setting clear entry, stop-loss, and take-profit levels.
Unlike subjective chart patterns, harmonic trading minimizes emotional biases by focusing on mathematical ratios. This structured approach fosters discipline, which is essential for consistent trading performance.
Whether trading short-term intraday moves or long-term trends, harmonic patterns can be applied to various timeframes and currency pairs, offering flexibility to different trading styles.
Harmonic patterns work well when combined with technical indicators like RSI, MACD, or trendlines, improving the reliability of trade setups.
Limitations of harmonic patterns:
Accurate pattern recognition requires a thorough understanding of Fibonacci ratios and chart structures. Novice traders may struggle without the aid of pattern recognition tools available on platforms like MetaTrader or TradingView.
During periods of high volatility, such as major economic announcements, patterns may fail, leading to false signals and increased risk.
While based on mathematical rules, some discretion is still required, particularly in determining the exact placement of Fibonacci levels.
Conclusion
Harmonic patterns in forex trading offer a rule-based method for identifying potential market reversals with high precision. Rooted in the principles of geometry and Fibonacci ratios, these patterns—such as the Gartley, Bat, Butterfly, and Crab—help traders forecast price movements based on historical price behavior and mathematical relationships. Unlike subjective chart patterns, harmonic patterns provide clear guidelines for entry, stop-loss, and take-profit levels, making them a valuable tool for both novice and experienced traders.
The structured nature of harmonic patterns appeals to traders seeking consistency and discipline in their strategies. By focusing on specific Fibonacci retracement and extension levels, traders can identify potential reversal zones (PRZ) with greater accuracy. Additionally, integrating harmonic patterns with other technical indicators like RSI, MACD, and moving averages can enhance the reliability of trade setups in forex markets.
In conclusion, it’s essential to recognize that harmonic patterns are not foolproof. Their effectiveness relies on accurate pattern identification, proper risk management, and confirmation through additional technical analysis tools. Market conditions, such as high volatility during economic announcements, can lead to false signals, highlighting the importance of a well-rounded trading strategy.