Divergence trading with MACD or RSI
If you have been trading forex for some time, you must have come across the quote “the trend is your friend.” But what happens when the trend becomes weak? That is where divergence trading comes in. It is a strategy that enables the trader to determine the likely change in trend before it happens, which is particularly useful in a volatile market condition.
Divergence is defined by the price action having one direction whilst other indicators such as the MACD or the RSI shows signs of weakening momentum. It is like the market is giving early signs of a shift. When applied properly, divergence can be a great asset in predicting changes in the price and preventing making the wrong decision in the trade.
Out of the many indicators, MACD and RSI are the most common ones used in divergence. MACD is based on the concept of two moving averages and as such, traders are able to determine the momentum and trend direction. RSI, on the other hand, is a momentum indicator that is designed to measure the speed and change in the price movements marking areas of technical analysis as overbought or oversold markets. Although both of the tools are effective when used separately, it is possible to get better signal confirmation from both of them at once.
What Is divergence in trading?
Divergence is one of those concepts that might seem complicated at first, but once you get it, it becomes a game-changer. In its simplest form, divergence is a concept that is used to identify when the price of a currency pair moves in one direction, but the technical indicator, whether MACD or RSI, is indicating the opposite. This mismatch can be an indication of weak momentum and possible trend reversal in the early stages.
There are two types of divergence: bullish divergence and bearish divergence.
- Bullish divergence happens when price makes lower lows, but the indicator makes higher lows. This suggests that while price action is still heading down, the selling pressure is weakening, and a potential upward reversal could be coming.
- Bearish divergence is the opposite—price makes higher highs, but the indicator makes lower highs. This signals that the uptrend might be losing strength, and a downside move could be ahead.
Divergence works because it shows a trend slowdown before it actually happens on the price chart. But here’s the key: divergence alone is not something that should make you leap into a trade right away. It’s a signal, not a guarantee. Intelligent traders employ divergence in conjunction with other technical indicators like trend lines, SR levels, and volume to improve their chances of success.
What is MACD and how it helps in divergence trading
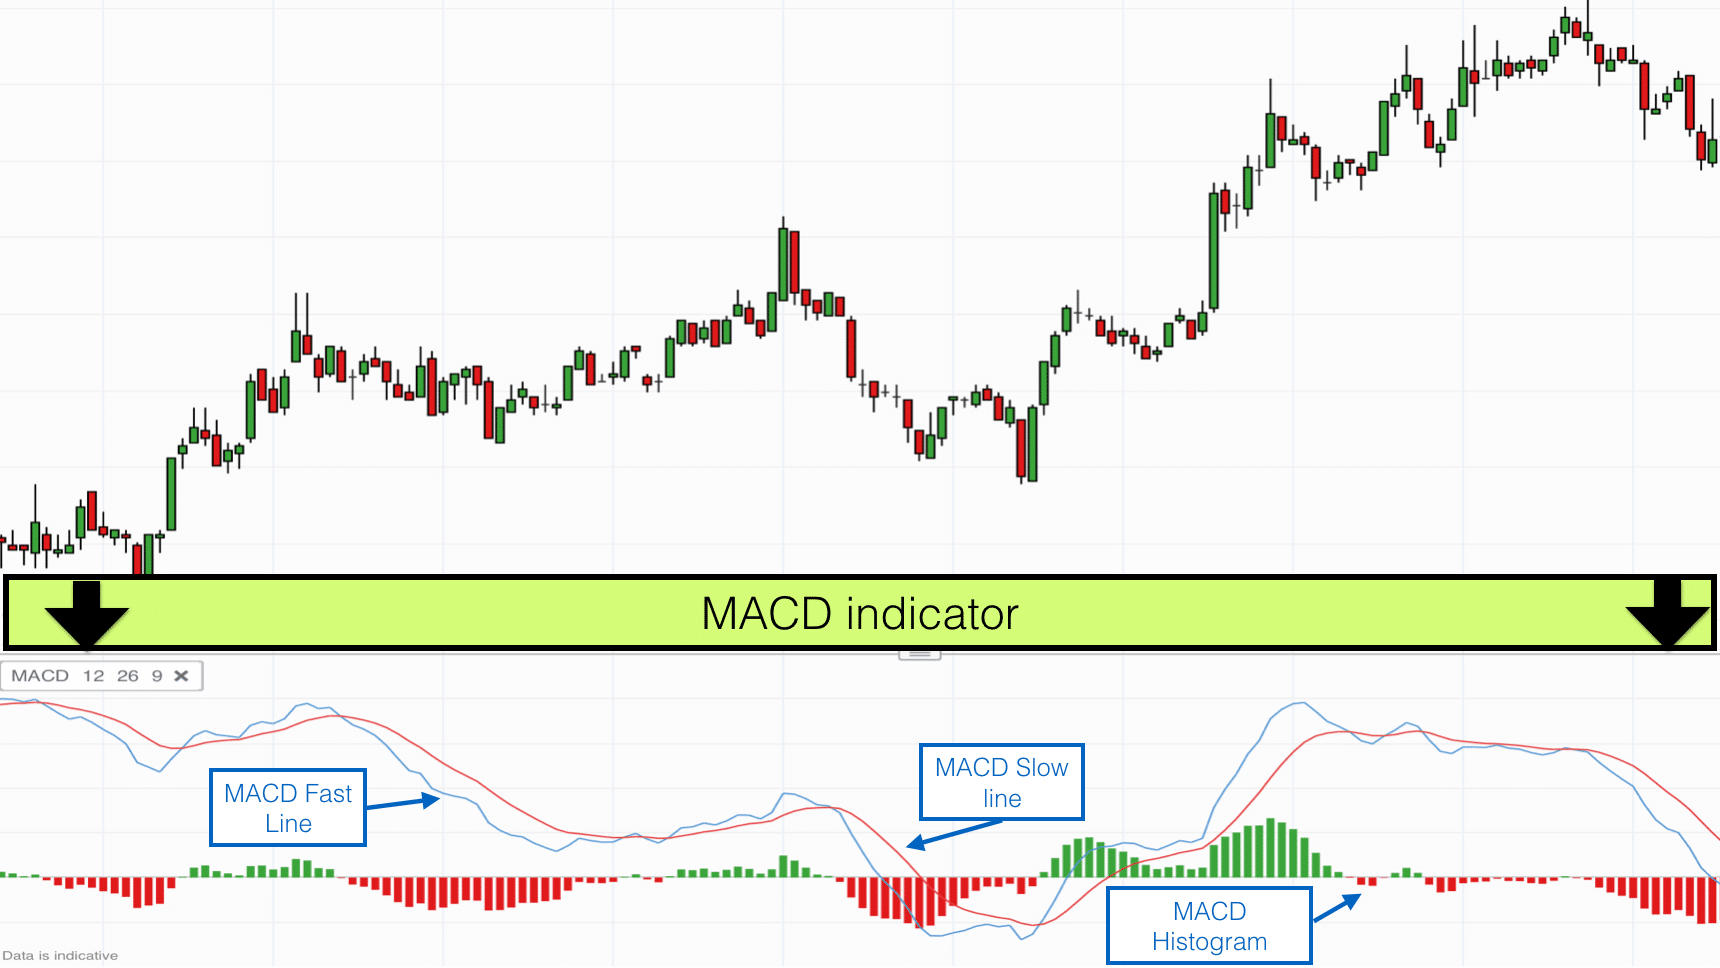
The MACD (Moving Average Convergence Divergence) is one of the most active tools in identifying divergence in the forex market. It is a momentum tool that helps the trader determine whether a trend is strengthening or weakening. But do not be put off by the name – MACD is actually rather simple when you look at it. In its simplest form, MACD is made up of three main elements: the MACD line, the signal line, and the histogram.
The MACD line is the difference between two moving averages, often 12 and 26 period EMAs, while the signal line is a 9 period EMA of the MACD line. The histogram is the distance between these two lines, in the form of a line graph that illustrates the speed behind price actions.
So how does MACD help spot divergence? It’s all about comparing price action with MACD movement:
- Bullish MACD divergence is identified by the price making a lower low, while the MACD line makes a higher low. It indicates that the downward momentum is weakening, and a reversal is possibly in the process of happening.
- Bearish MACD divergence is when price forms a higher high, while the MACD line forms a lower high. This is a sign that the buying pressure is waning and there could be a shift lower.
This is why traders love MACD, it doesn’t just show divergence, it also helps to confirm the overall trend direction. However, like any indicator, it isn’t foolproof. The main idea is to use MACD divergence in conjunction with other confirmations, like support/resistance levels or candlestick patterns, to improve your chances of a successful trade.
Understanding RSI and its role in divergence trading
The Relative Strength Index (RSI) is another tool which can be used by traders to identify divergence and possible trend reversals. Unlike MACD, which focuses on moving averages and trend momentum, RSI compares the speed and the power of the price change to determine the overbought and oversold levels. Think of it as a pressure gauge for the market— when the pressure rises or falls too high, a reversal may be due.
RSI is plotted on a scale from 0 to 100, with traditional levels set at 70 and 30:
- Above 70 – The market is considered overbought, meaning buyers might be running out of steam.
- Below 30 – The market is oversold, suggesting that sellers may be losing strength.
Divergence occurs when price action is moving one direction, while RSI moves the opposite direction, signalling that momentum is shifting:
- Bullish RSI divergence happens when price makes a lower low, but RSI makes a higher low. This suggests selling pressure is weakening, and a potential reversal to the upside could be forming.
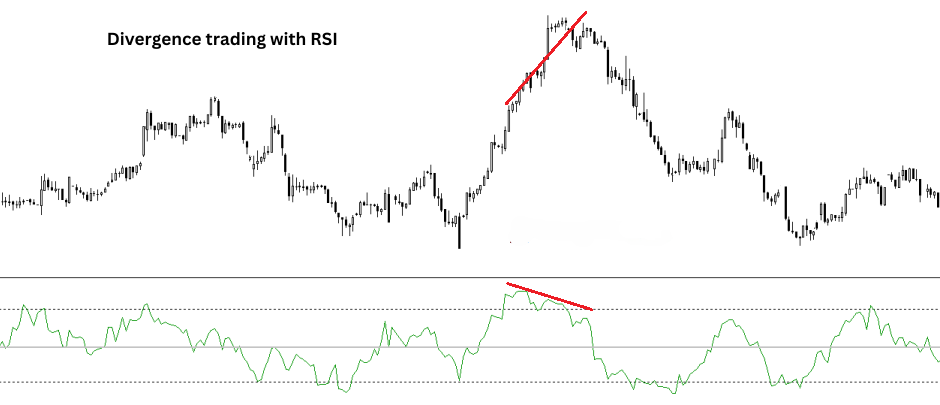
- Bearish RSI divergence occurs when price makes a higher high, but RSI makes a lower high. This hints that buying momentum is fading, and a downtrend might be ahead.
RSI is particularly useful in range-bound markets where price is bouncing between support and resistance levels. However, it can also produce false signals in strongly trending markets. That’s why traders often use RSI alongside other indicators—like MACD or trendlines—to confirm divergence signals before taking action.
Comparing MACD and RSI for divergence trading
As a trending market indicator, MACD is best used. As a moving average-based indicator, it is quite efficient in the context of a price that has a clear direction. When you are in a strong uptrend or downtrend, MACD divergence can assist in informing you when the momentum is winding down and there is a possibility of a reversal. However, since it is based on moving averages, MACD can sometimes lag behind the price action and may not be very effective in fast moving markets.
On the other hand, RSI is excellent in range bound markets where the price is trapped between support and resistance levels. RSI is an earlier divergence signal than MACD because it is based on overbought and oversold conditions. However, RSI can sometimes give false signals during strong trends, especially when the market is overbought or oversold for a long period of time. That’s why traders usually wait for the RSI to revert back below 70 (or above 30) after divergence appears before entering the trade.
Common mistakes traders make with divergence
Divergence trading can be effective, but it is not a panacea. There are many traders who are happy to see divergence on the MACD or the RSI and then, they tend to enter the trade before thinking rationally and end up losing. The truth is, divergence is but a signal, not a guarantee. Here are some of the most common mistakes traders make when using divergence and how to avoid them.
One of the biggest pitfalls is ignoring the overall trend. It doesn’t necessarily mean the market will correct itself the moment you see divergence. If the general trend is strong, then divergence may indicate only the tendency to correct rather than the complete reversal. That’s why experienced traders combine divergence with trend analysis, using tools like moving averages or trendlines to determine whether a reversal is probable.
Another mistake is considering divergence as a separate entry signal. Divergence should always be supported by other signals, such as support and resistance levels, candlestick patterns or volume indicators. This is because using divergence on its own will lead to wrong signals especially during choppy or ranging markets.
Timing is another issue. Using the wrong timeframe will result in wrong signals. Divergence on a one-minute chart is not as reliable as divergence on a four hour or daily chart. Higher timeframes usually give better signals than lower timeframes because they are less sensitive to market noise.
Finally, traders tend to forget about fundamentals. A good economic news, a decision of a central bank or a geopolitical risk can nullify a divergence signal. It is always important to keep an eye on news in order not to get caught off guard.
Conclusion
Using MACD or RSI in divergence trading isn’t about predicting the market with absolute certainty – it’s about making the probabilities work for you. When used correctly, divergence can serve as a leading indicator of trend exhaustion, thus enabling traders to enter the market before the reversal unfolds. The only catch is to know how to ignore the false signals and use divergence in conjunction with other technical indicators.
MACD works best in trending markets, while RSI shines in range-bound conditions. Neither is better than the other—it all depends on the context. Many traders use them together to confirm high-probability setups, reducing the risk of being misled by a single indicator.
What is the biggest mistake traders make? Jumping in too early. Just because you see divergence doesn’t mean price will immediately reverse. Always wait for confirmation—whether that’s a break of a key support/resistance level, a candlestick pattern, or volume confirmation. Timing matters.
Most importantly, risk management should always come first. A stop loss placed well, and a clear profit target are essential for staying in the game in the long run. No strategy is 100% effective, but by trading with a plan, traders can limit their risks and increase their potential for gains.